Interpreting IR Spectra
Interpreting IR Spectra
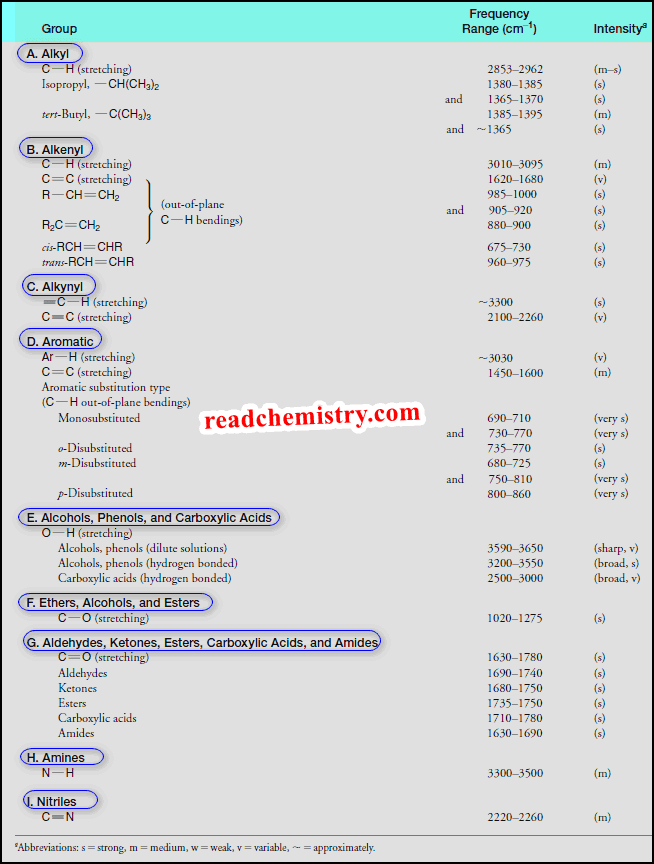
– IR spectra contain a wealth of information about the structures of compounds.
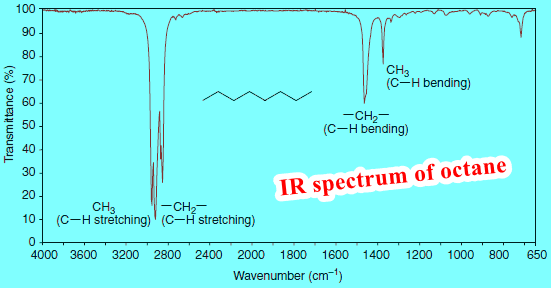
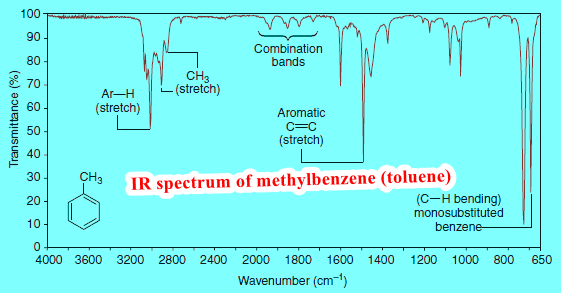
– We show some of the information that can be gathered from the spectra of octane and methylbenzene (commonly called toluene) in Figs.1 and 2.
– In this subject, we shall learn how to recognize the presence of characteristic IR absorption peaks that result from vibrations of alkyl and functional groups.
– The data given in the following Table will provide us with key information to use when correlating actual spectra with IR absorption frequencies that are typical for various groups.
IR Spectra of Hydrocarbons
Observation (1)
All hydrocarbons give absorption peaks in the 2800–3300 cm-1 region that are associated with carbon-hydrogen stretching vibrations.
– We can use these peaks in interpreting IR spectra because the exact location of the peak depends on the strength (and stiffness) of the C-H bond, which in turn depends on the hybridization state of the carbon that bears the hydrogen.
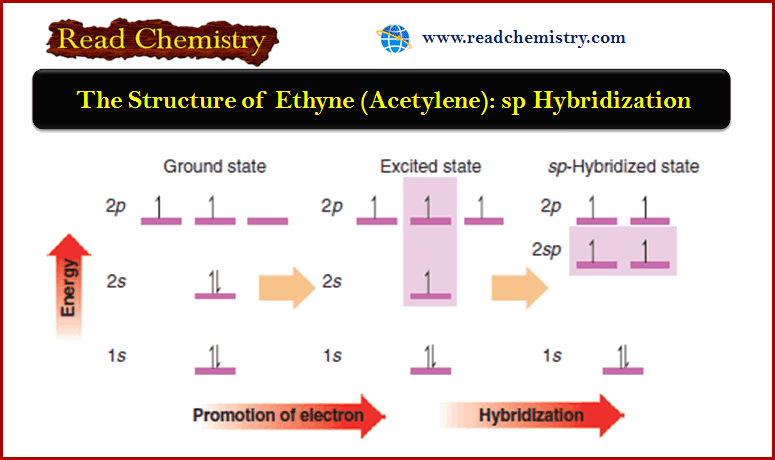
– The C-H bonds involving sp-hybridized carbon are the strongest and those involving sp3-hybridized carbon are the weakest.
– The order of bond strength is:
sp > sp2 > sp3
– This, too, is the order of the bond stiffness.
Observation (2)
The carbon-hydrogen stretching peaks of hydrogen atoms attached to sp-hybridized carbon atoms occur at the highest frequencies, about 3300 cm-1.
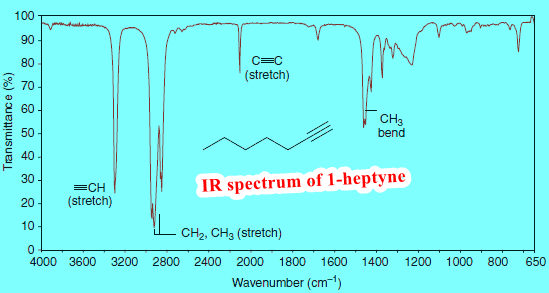
– The carbon-hydrogen bond of a terminal alkyne (≡C-H) gives an absorption in the 3300 cm-1 region.
– We can see the absorption of the acetylenic (alkynyl) C-H bond of 1-heptyne at 3320 cm-1 in the following Figure.
Observation (3)
The carbon-hydrogen stretching peaks of hydrogen atoms attached to sp2-hybridized carbon atoms occur in the 3000–3100 cm-1 region.
– Thus, alkenyl C-H bonds and the C-H groups of aromatic rings give absorption peaks in this region.
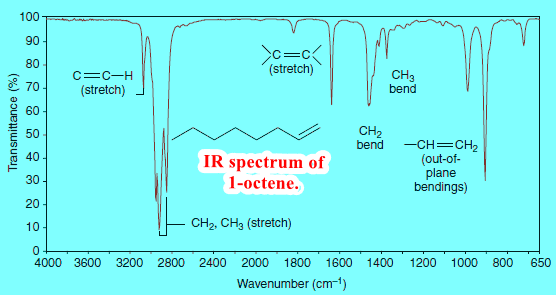
– We can see the alkenyl C-H absorption peak at 3080 cm-1 in the spectrum of 1-octene (Fig. 4), and we can see the C-H absorption of the aromatic hydrogen atoms at 3090 cm-1 in the spectrum of methylbenzene (Fig. 2).
Observation (4)
The carbon-hydrogen stretching bands of hydrogen atoms attached to sp3-hybridized carbon atoms occur at the lowest frequencies, in the 2800–3000 cm-1 region.
– We can see methyl and methylene absorption peaks in the spectra of octane (Fig. 1), methylbenzene (Fig. 2), 1-heptyne (Fig. 3), and 1-octene (Fig. 4).
– Hydrocarbons also give absorption peaks in their IR spectra that result from carbon-carbon bond stretchings.
– Carbon-carbon single bonds normally give rise to very weak peaks that are usually of little use in assigning structures.
– More useful peaks arise from carbon-carbon multiple bonds, however.
Observation (5)
Carbon-carbon double bonds give absorption peaks in the 1620–1680 cm-1 region, and carbon-carbon triple bonds give absorption peaks between 2100 and 2260 cm-1.
– These absorptions are not usually strong ones, and they are absent if the double or triple bond is symmetrically substituted. (No dipole moment change will be associated with the vibration.)
– The stretchings of the carbon-carbon bonds of benzene rings usually give a set of characteristic sharp peaks in the 1450–1600 cm-1 region.
Observation (6)
Absorptions arising from carbon-hydrogen bending vibrations of alkenes occur in the 600–1000 cm-1 region.
– With the aid of a spectroscopy handbook, the exact location of these peaks can often be used as evidence for the substitution pattern of the double bond and its configuration.
IR Spectra of Some Functional Groups Containing Heteroatoms
– Infrared spectroscopy gives us an invaluable method for recognizing quickly and simply the presence of certain functional groups in a molecule.
(1) IR Spectra of Carbonyl Functional Groups
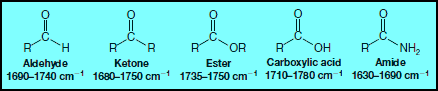
– One important functional group that gives a prominent absorption peak in IR spectra is the carbonyl group, C=O.
– This group is present in aldehydes, ketones, esters, carboxylic acids, amides, and others.
– The carbon-oxygen double-bond stretching frequency of carbonyl groups gives a strong peak between 1630 and 1780 cm-1.
– The exact location of the absorption depends on whether it arises from an aldehyde, ketone, ester, and so forth.
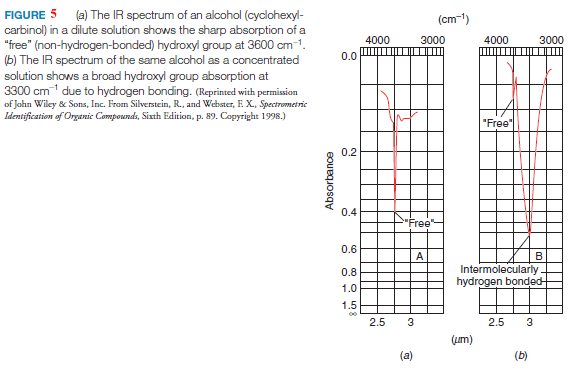
(2) IR Spectra of Alcohols and Phenols
– The hydroxyl groups of alcohols and phenols are also easy to recognize in IR spectra by their O-H stretching absorptions.
– These bonds also give us direct evidence for hydrogen bonding.
– The IR absorption of an alcohol or phenol O-H group is in the 3200–3550 cm-1 range, and most often it is broad.
– The typical broadness of the peak is due to the association of the molecules through hydrogen bonding, which causes a wider distribution of stretching frequencies for the O-H bond.
(a) If alcohol or phenol is present as a very dilute solution in a solvent that cannot contribute to hydrogen bonding (e.g., CCl4), O-H absorption occurs as a very sharp peak in the 3590–3650 cm-1 region.
(b) In a very dilute solution in such a solvent or the gas phase, the formation of intermolecular hydrogen bonds does not take place because molecules of the analyte are too widely separated.
(c) A sharp peak in the 3590–3650 cm-1 region, therefore, is attributed to “free” (unassociated) hydroxyl groups.
(d) Increasing the concentration of the alcohol or phenol causes the sharp peak to be replaced by a broad band in the 3200–3550 cm-1 region.
– Hydroxyl absorptions in IR spectra of cyclohexylcarbinol (cyclohexylmethanol) run in dilute and concentrated solutions (Fig. 5) exemplify these effects.
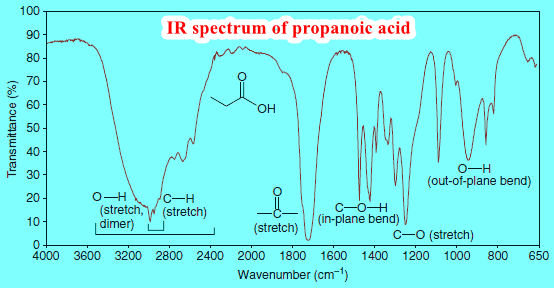
(3) IR Spectra of Carboxylic Acids
– The carboxylic acid group can also be detected by IR spectroscopy.
– If both carbonyl and hydroxyl stretching absorptions are present in an IR spectrum, there is good evidence for a carboxylic acid functional group (although it is possible that isolated carbonyl and hydroxyl groups could be present in the molecule).
– The hydroxyl absorption of a carboxylic acid is often very broad, extending from 3600 cm-1 to 2500 cm-1.
– Figure 6 shows the IR spectrum of propanoic acid.
(4) IR Spectra of Amines
– IR spectroscopy also gives evidence for N-H bonds (see Figure).
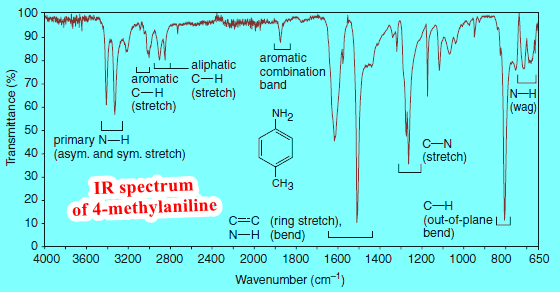
(a) Primary (1o) and secondary (2o) amines give absorptions of moderate strength in the 3300–3500 cm-1 region.
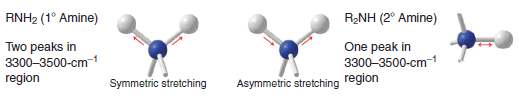
(b) Primary amines exhibit two peaks in this region due to symmetric and asymmetric stretching of the two N-H bonds.
(c) Secondary amines exhibit a single peak.
(d) Tertiary amines show no N-H absorption because they have no such bond.
(e) A basic pH is evidence for any class of amine.
– Hydrogen bonding causes N-H stretching peaks of 1o and 2o amines to broaden.
– The NH groups of amides give similar absorption peaks and include a carbonyl absorption as well.
– Hydrogen bonding causes N-H stretching peaks of 1o and 2o amines to broaden.
– The NH groups of amides give similar absorption peaks and include a carbonyl absorption as well.
Solved Problems on Interpreting IR Spectra
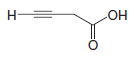
(1) A compound with the molecular formula C4H4O2 has a strong sharp absorbance near 3300 cm-1, absorbances in the 2800–3000 cm-1 region, and a sharp absorbance peak near 2200 cm-1. It also has a strong broad absorbance in the 2500–3600 cm-1 region and a strong peak in the 1710–1780 cm-1 region. Propose a possible structure for the compound.
Strategy and Answer:
– The sharp peak near 3300 cm-1 is likely to arise from the stretching of hydrogen attached to the sp-hybridized carbon of a triple bond.
– The sharp peak near 2200 cm-1, where the triple bond of an alkyne stretches, is consistent with this.
– The peaks in the 2800–3000 cm-1 region suggest stretchings of the C-H bonds of alkyl groups, either CH2 or CH3 groups.
– The strong, broad absorbance in the 2500–3600 cm-1 region suggests a hydroxyl group arising from a carboxylic acid.
– The strong peak around 1710–1780 cm-1 is consistent with this since it could arise from the carbonyl group of a carboxylic acid.
– Putting all this together with the molecular formula suggests the compound is:
(2) What key peaks would you expect to find in the IR spectrum of the following compound?

Strategy and Answer:
– The compound is an amide.
– We should expect a strong peak in the 1630–1690 cm-1 region arising from the carbonyl group and a single peak of moderate strength in the 3300–3500 cm-1 region for the N-H group.
Reference: Organic chemistry / T.W. Graham Solomons, Craig B.Fryhle, Scott A. Snyder, / ( eleventh edition) / 2014.