Areas of the Peaks in NMR Spectroscopy
– In this topic, we will discuss The Areas of the Peaks in NMR Spectroscopy
Areas of the Peaks
– The area under a peak is proportional to the number of hydrogens contributing to that peak.
– For example, in the methyl tert-butyl ether spectrum (Figure 1), the absorption of the tert-butyl protons is larger and stronger than that of the methoxy protons because there are three times as many tert-butyl protons as methoxy protons.
– We cannot simply compare peak heights, however; the area under the peak is proportional to the number of protons.
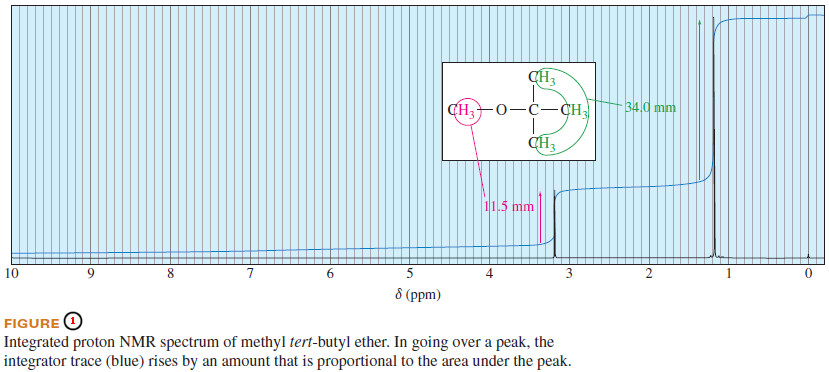
– NMR spectrometers have integrators that compute the relative areas of peaks.
– The integrator draws a second trace (the integral trace) that rises when it goes over a peak.
– The amount the integral trace rises is proportional to the area of that peak. You can measure these integrals using a millimeter ruler.
– Newer digital instruments also print a number representing the area of each peak. These numbers correspond to the heights of the rises in the integral trace.
– Neither an integral trace (shown in blue in Figure 1) nor a digital integral can specifically indicate that methyl tert-butyl ether has three methyl hydrogens and nine tert-butyl hydrogens.
– Each simply shows that about three times as many hydrogens are represented by the peak at δ 1.2 as are represented by the peak at δ 3.2.
– We must interpret what the 3 : 1 ratio means in terms of the structure.
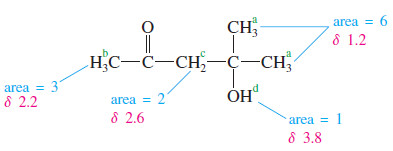
– Figure 2 shows the integrated spectrum of a compound with molecular formula C6H12O2.
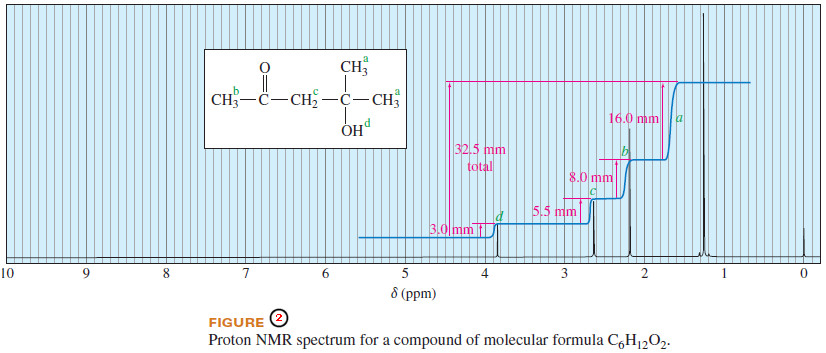
– Because we know the molecular formula, we can use the integral trace to determine exactly how many protons are responsible for each peak.
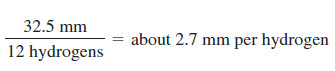
– The integrator has moved a total of 32.5 mm vertically in integrating the 12 protons in the molecule.
– Each proton is represented by:
– The signal at has an integral of 3.0 mm, so it must represent one proton.
– At the integrator moves 5.5 mm, corresponding to two protons.
– The signal at has an integral of 8.0 mm, for three protons; and the signal at (16.0 mm) corresponds to six protons.
– Considering the expected chemical shifts together with the information provided by the integrator leaves no doubt which protons are responsible for which signals in the spectrum.
References:
- Organic chemistry / L.G. Wade, Jr / 8th ed, 2013 / Pearson Education, Inc. USA.
- Fundamental of Organic Chemistry / John McMurry, Cornell University/ 8th ed, 2016 / Cengage Learningm, Inc. USA.
- Organic Chemistry / T.W. Graham Solomons, Craig B. Fryhle , Scott A. Snyder / 11 ed, 2014/ John Wiley & Sons, Inc. USA.