IR Spectrum – Measurement of the IR Spectrum
– In this subject, we talk about how to Measure the IR Spectrum.
Measurement of the IR Spectrum
– Infrared spectra can be measured using liquid, solid, or gaseous samples that are placed in the beam of infrared light.
– A drop of a liquid can be placed as a thin film between two salt plates made of NaCl or KBr, which are transparent to infrared light at the most important frequencies.
– A solid can be ground with KBr and pressed into a disk that is placed in the light beam.
– Alternatively, a solid sample can be ground into a pasty mull with paraffin oil.
– As with a liquid, the mull is placed between two salt plates.
– Solids can also be dissolved in common solvents such as CH2Cl2, CCl4, or CS2 that do not have absorptions in the areas of interest.
– Gases are placed in a longer cell with polished salt windows.
– These gas cells often contain mirrors that reflect the beam through the cell several times for stronger absorption.
Infrared spectrometer to measure IR Spectrum
– An infrared spectrometer measures the frequencies of infrared light absorbed by a compound.
– In a simple infrared spectrometer (Figure), two beams of light are used.
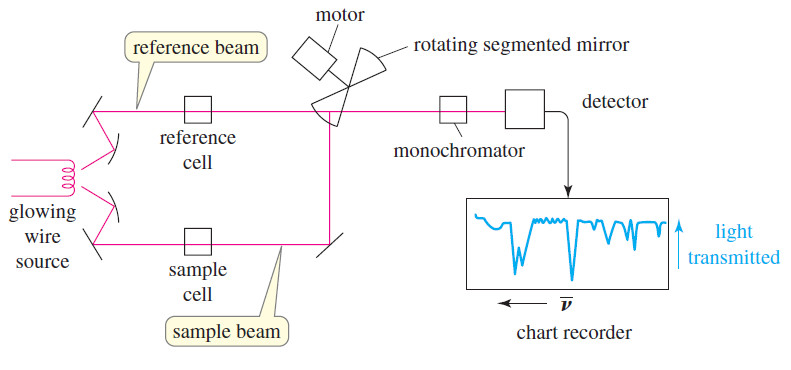
– The sample beam passes through the sample cell, while the reference beam passes through a reference cell that contains only the solvent.
– A rotating mirror alternately allows light from each of the two beams to enter the monochromator
– The monochromator uses prisms or diffraction gratings to allow only one frequency of light to enter the detector at a time.
– It scans the range of infrared frequencies as a pen moves along the corresponding frequencies on the x-axis of the chart paper.
– Higher frequencies (shorter wavelengths) appear toward the left of the chart paper.
– The detector signal is proportional to the difference in the intensity of light in the sample and reference beams, with the reference beam compensating for any absorption by air or by the solvent.
– The detector signal controls the movement of the pen along the y-axis, with 100% transmittance (no absorption) at the top of the paper, and 0% transmittance (absorption of all the light) at the bottom.
Dispersive Infrared spectrometers
– The spectrometer shown in the Figure above is called a dispersive instrument because it disperses light into all the different frequencies and measures them individually.
– Dispersive instruments require expensive prisms and diffraction gratings, and they must be manually aligned and calibrated on a regular basis.
– Since only one frequency is observed at a time, dispersive instruments require strong IR sources, and they require 2 to 10 minutes to scan through a complete spectrum.
– Dispersive infrared spectrometers are being replaced by Fourier transform infrared (FT–IR) spectrometers for most uses.
Fourier Transform Infrared spectrometer (FT–IR)
– A Fourier transform infrared spectrometer (FT–IR) uses an interferometer, like that shown in Figure below, to measure an IR spectrum.
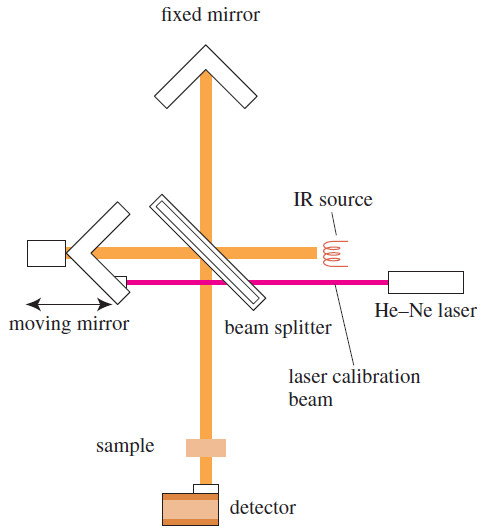
– The infrared light goes from the glowing source to a beamsplitter, usually made of polished KBr, placed at a 45° angle.
– Part of the beam passes through the beamsplitter, and part is reflected at a right angle.
– The reflected beam strikes a stationary mirror, while the transmitted beam strikes a mirror that moves at a constant speed.
– The beams return from the mirrors to recombine at the beamsplitter.
– The beam from the moving mirror has traveled a different distance than the beam from the fixed mirror, and the two beams combine to create an interference pattern called an interferogram.
– This interferogram, which simultaneously contains all frequencies, passes through the sample compartment to reach the detector.
– The interferogram shown in the upper half of the Figure below contains all the information contained in the spectrum shown in the lower half.
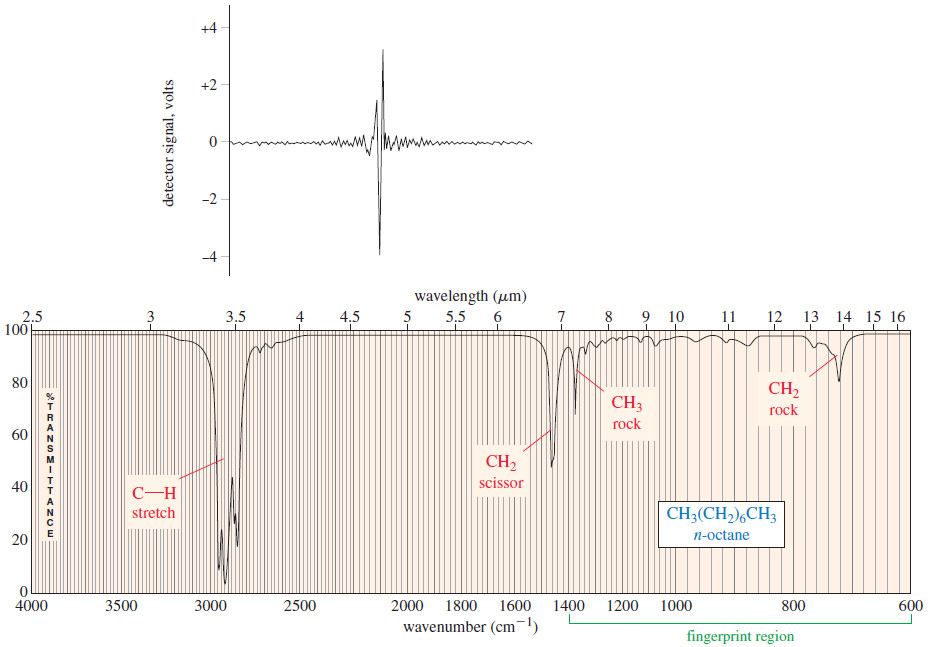
– The interferogram is said to be in the time domain, corresponding to the energy seen by the detector as the mirror moves through the signal.
– A standard computer algorithm called a Fourier transform converts the time domain to the frequency domain spectrum allowing us to see the strength of absorption as a function of the frequency (or wavelength).
– The figure above shows both the interferogram and the IR spectrum of n-octane.
Advantages of FT-IR spectrometer
– The FT–IR spectrometer has several major advantages over the dispersive instrument:
– Its sensitivity is better because it measures all frequencies simultaneously rather than scanning through the individual frequencies.
– Less energy is needed from the source, and less time (typically 1 to 2 seconds) is needed for a scan.
– Several scans can be completed in a few seconds and averaged to improve the signal.
– Resolution and accuracy are also improved because a laser beam is used alongside the IR beam to control the speed of the moving mirror and to time the collection of data points.
– The laser beam is a precise frequency reference that keeps the spectrometer accurately calibrated.
The IR spectrum of n-octane
– In the infrared spectrum of n-octane [Figure(b)] there are four major absorption bands.
– The broadband between 2800 and 3000 cm-1 results from C-H stretching vibrations, and the band at 1467 cm-1 results from a scissoring vibration of the groups.
– The absorptions at 1378 and 722 cm-1 result from the bending vibrations (rocking) of the CH3 and CH2 groups, respectively.
– Since most organic compounds contain at least some saturated C-H bonds and some CH2 and CH3 groups, all these bands are common.
In fact, without an authentic spectrum for comparison, we could not look at this spectrum and conclude that the compound is octane.
– We could be fairly certain that it is an alkane, however, because we see no absorption bands corresponding to other functional groups.
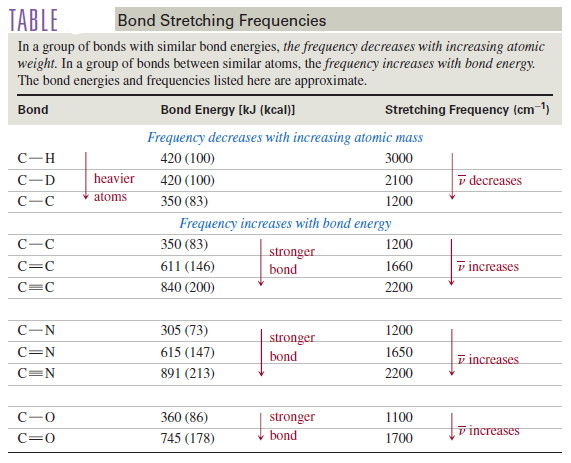
– Another characteristic of the octane spectrum is the absence of any identifiable C-C stretching absorptions.
– the Table shows that C-C stretching absorptions occur around 1200 cm-1 Although there are seven C-C bonds in octane, their dipole moments are small, and their absorptions are weak and indistinguishable.
– This result is common for alkanes with no functional groups to polarize the C-C bonds.