Phase diagram – Phase Rule
Phase Diagram
– A phase diagram is a plot showing the conditions of pressure and temperature under which two or more physical states can exist together in a state of dynamic equilibrium.
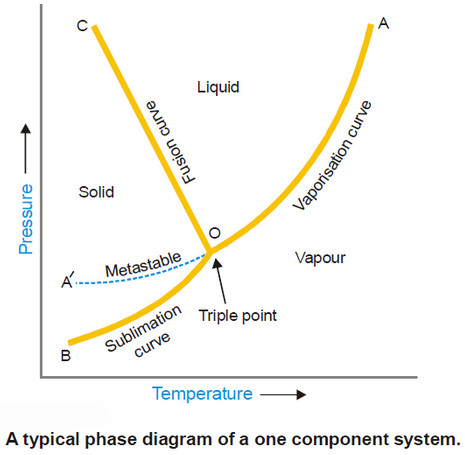
– The following figure is a typical phase diagram for a one-component system.
– The diagram consists of :
(a) the Regions or Areas
(b) the Lines or Curves
(c) the Triple point.
– The significance of the characteristic features (Areas, Curves, Triple point) of a phase diagram are discussed below.
(1) Regions or Areas in the phase diagram
– The diagram is divided into three regions or areas which are labelled as (solid), (liquid), and (vapour).
– These areas in Fig. above are COB, COA and AOB. Each of the three areas shows the conditions of temperature and pressure under which the respective phase can exist.
– Applying the phase rule to the system when only one phase is present, we have:
F = 1 – 1 + 2 = 2
– i.e., each single phase has two degrees of freedom.
– Thus each area of phase diagram represents a bivariant system.
– At conditions wholly within one of the three areas, both the variables (pressure and temperature) can be varied independently without causing a change in the state of equilibrium.
– Therefore in order to define the condition of the phase both pressure and temperature must be stated.
(2) Lines or Curves in the phase diagram
– There are three lines or curves separating the regions or areas.
– These curves show the conditions of equilibrium between any two of the three phases i.e., solid/liquid, liquid/vapour, solid/vapour.
(a) Solid/liquid line (OC) which represents the equilibrium Solid ↔ Liquid, is referred to as the Melting curve or Fusion curve.
(b) Liquid/vapour line (OA) which represents the equilibrium Liquid ↔ Vapour, is referred to as the Vapour Pressure curve or Vaporisation curve for the liquid.
(c) Solid/vapour line (OB), which represents the equilibrium Solid ↔ Vapour, is referred to as the Sublimation curve.
– Applying phase rule to a one-component two-phase system.
F = C – P + 2 = 1 – 2 + 2 = 1
– Thus phase rule predicts that the two phase equilibria stated above will have one degree of freedom.
– Along any of three lines on the phase diagram when one variable (pressure or temperature) is specified, the other is fixed automatically.
(3) Triple Point
– The three boundary lines enclosing the three areas on the phase diagram intersect at a common point called the Triple point.
– A triple point shows the conditions under which all the three phases (solid, liquid, vapour) can coexist in equilibrium.
– Thus the system at the triple point may be represented as :
Solid ↔ Liquid ↔ Vapour
– Applying the phase rule equation, we have
F = C – P + 2 = 1 – 3 + 2 = 0
which predicts that the system has no degree of freedom.
– At the triple point both pressure and temperature on the diagram are fixed and, therefore, the system is nonvariant. This implies that if we try to change temperature or pressure, the equilibrium will be disturbed.
– For example, if we lower the pressure on the system, all the liquid will vaporise, leaving only two phases.
– In case of water system, the temperature and pressure for the triple point are 0.0076º and 4.58 mm Hg respectively.
Metastable Equilibrium
– The vapour pressure curve AO of the liquid phase terminates at O, when the liquid freezes (or solidifies).
– However by careful cooling of the liquid under conditions that crystals do not form, the curve AO can be extended to A’.
– This means that the liquid can be cooled far below the freezing point or ‘supercooled’ without separation of the crystals.
– The supercooled liquid is in an unstable condition.
– On the slightest disturbance as introduction of a seed crystal, the entire liquid solidifies rapidly.
– Thus the dashed curve OA’ represents a metastable equilibrium,
Supercooled Liquid ↔ Vapour
– This system at once reverts to the true stable system
Solid ↔ Vapour
under suitable conditions.
– It is noteworthy that the dashed curve of the metastable liquid lies above the normal sublimation curve (BO).
– This implies that the vapour pressure of the metastable phase is always higher than that of the stable phase at the same temperature.