Sulphur system – Phase diagram of Sulphur
The Sulphur system
– Sulphur system is a one-component, four-phase system.
– The four phases are:
(a) Two solid polymorphic forms :
- Rhombic Sulphur (SR)
- Monoclinic Sulphur (SM)
(b) Sulphur Liquid (SL)
(c) Sulphur Vapour (SV)
– All the four phase can be represented by the only chemical individual (sulphur) itself and hence one component of the system.
– The two crystalline forms of sulphur SR and SM exhibit enantiotropy with a transition point at 95.6ºC. Below this temperature SR is stable, while above it SM is the stable variety.
– At 95.6ºC each form can be gradually transformed to the other and the two are in equilibrium.
– At 120ºC, SM melts.
Thus,
![]()
Phase diagram for the sulphur system
– The phase diagram for the sulphur system is shown in this figure:
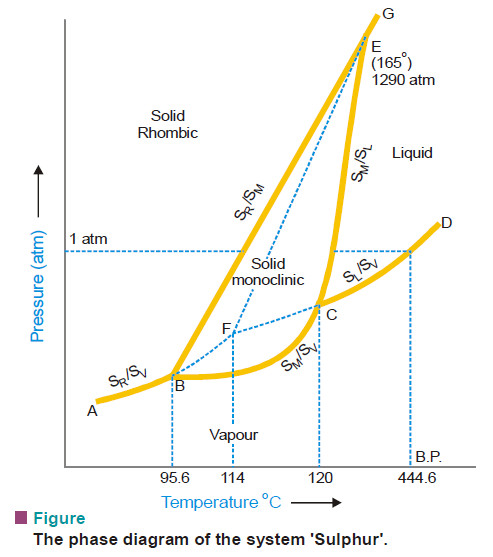
– The salient features of the phase diagram are described below.
(1) The six curves AB, BC, CD, BE, CE, EG
(2) The three Triple points B, C, E
(3) The four areas :
- ABG marked (solid Rhombic)
- BEC marked (solid Monoclinic)
- GECD marked (liquid Sulphur)
- ABCD marked (Sulphur vapour)
– Let us now proceed to discuss the significance of these features :
(1) The curves AB, BC, CD, BE, CE, EG
– These six curves divide the diagram into four areas.
Curve AB
– The Vapour Pressure curve of SR.
– It shows the vapour pressure of solid rhombic sulphur (SR) at different temperatures.
– Along this curve the two phases SR and sulphur vapour (SV) are in equilibrium.
– The system SR/SV has one degree of freedom,
F = C – P + 2 = 1 – 2 + 2 = 1
i.e., it is monovariant.
Curve BC
– The Vapour Pressure curve of SM.
– It shows variation of the vapour pressure of monoclinic sulphur (SM) with temperature.
– SM and SV coexist in equilibrium along this curve.
– The system SM/SV is monovariant.
Curve CD
– The Vapour Pressure curve of SL.
– It depicts the variation of the vapour pressure of liquid sulphur (SL) with temperature.
– SL and SV are in equilibrium along CD.
– The two phase system SL/SV is monovariant.
– One atmosphere line meets this curve at a temperature (444.6ºC) which is the boiling point of sulphur.
Curve BE
– The Transition curve.
– It shows the effect of pressure on the transition temperature for SR and SM.
– As two solid phases are in equilibrium along the curve, the system SR/SM is monovariant.
– The transformation of SR and SM is accompanied by increase of volume (density of SR = 2.04; SM = 1.9) and absorption of heat i.e.,
SR + Q (heat energy) ↔ SM
– Thus the increase of pressure will shift the equilibrium to the left (Le Chatelier’s Principle) and the transition temperature will, therefore, be raised.
– This is why the line BE slopes away from the pressure axis showing thereby that the transition temperature is raised with increase of pressure.
Curve CE
– The Fusion curve of SM.
– It represents the effect of pressure on the melting point of SM.
– The two phases in equilibrium along this curve are SM and SL.
– The system SM/SL is monovariant.
– As the melting or fusion of SM is accompanied by a slight increase of volume, the melting point will rise by increase of pressure (Le Chatelier’s principle).
– Thus the curve CE slopes slightly away from the pressure axis.
– The curve ends at E because SM ceases to exist beyond this point.
Curve EG
– The Fusion curve for SR.
– Here the two phases in equilibrium are SR and SL.
– The number of phases being two, the system SR/SL is monovariant.
(2) The Triple points B, C, E
Triple point B
– This is the meeting point of the three curves AB, BC and BE.
– Three phases, solid SR, solid SM and SV are in equilibrium at the point B.
– There being three phases and one component, the system SR/SM/SL is nonvariant.
F = C – P + 2 = 1 – 3 + 2 = 0
– At B, SR is changed to SM and the process is reversible.
– Thus the temperature corresponding to B is the transition temperature (95.6ºC).
Triple point C
– The curves BC, CD, CE meet at this point.
– The three phases in equilibrium are SM, SL and SV.
– There being three phases and one component, the system SM/SL/SV is nonvariant.
– The temperature corresponding to C as indicated on the phase diagram is 120ºC. This is the melting point of SM.
Triple point E
– The two lines CE and BE, having different inclinations away from the pressure axis, meet at E where a third line EG also joins.
– The three phases SR, SM and SL are in equilibrium and the system at the point E is nonvariant.
– This point gives the conditions of existence of the system SR/SM/SL at 155ºC and 1290 atmospheres pressure.
(3) The Areas
– The phase diagram of the sulphur system has four areas or regions.
– These are labelled as rhombic sulphur, monoclinic sulphur, liquid sulphur and vapour.
– These represent single phase systems which have two degrees of freedom,
F = C – P + 2 = 1 – 1 + 2 = 2
– That is, each of the systems SR, SM, SL, and SV are bivariant.
(4) Metastable Equilibria
– The change of SR to SM takes place very slowly.
– If enough time for the change is not allowed and SR is heated rapidly, it is possible to pass well above the transition point without getting SM.
– In that case, there being three phases (SR, SL, SV) only and one component, the phase diagram, like that of water system, will consist of three curves, one triple point and three areas.
The dashed curve BF
– The Vapour Pressure curve of metastable SR.
– This is a continuation of the vapour pressure curve AB of stable SR.
– The metastable phases SR and SV are in equilibrium along this curve.
– It is a monovariant system.
The dashed curve CF
– The Vapour Pressure curve of supercooled SL.
– On supercooling liquid sulphur, the dashed curve CF is obtained.
– It is, in fact, the back prolongation of DC.
– The curve CF represents the metastable equilibrium between supercooled SL and SV.
– Thus it may be designated as the vapour pressure curve of supercooled SL.
– It meets the dashed curve BF at F.
The dashed curve FE
– The Fusion curve of metastable SR.
– The two metastable phases SR and SL are in equilibrium along this curve and the system is monovariant.
– This shows that the melting point of metastable SR is increased with pressure.
– Beyond E, this curve depicts the conditions for the stable equilibrium SR/SL as the metastable SR disappears.
The metastable Triple point F
– At this point, three metastable phases SR, SL and SV are in equilibrium.
– The system is a metastable triple point with no degree of freedom.
– The corresponding temperature is the melting point of metastable SR (114ºC).