Atomic Spectrum of Hydrogen
– In this subject, we will discuss the atomic Spectrum of Hydrogen

Atomic Spectrum
– When an element in the vapour or the gaseous state is heated in a flame or a discharge tube, the atoms are excited (energised) and emit light radiations of a characteristic colour.
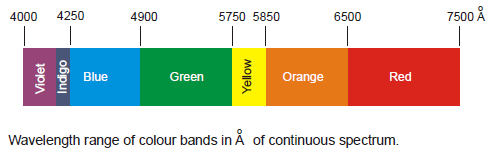
– The colour of light produced indicates the wavelength of the radiation emitted.
– For example, a Bunsen burner flame is coloured yellow by sodium salts, red by strontium and violet by potassium.
– In a discharge tube, neon glows orange-red, helium-pink, and so on.
– If we examine the emitted light with a Spectroscope (a device in which a beam of light is passed through a prism and received on a photograph), the spectrum obtained on the photographic plate is found to consist of bright lines.
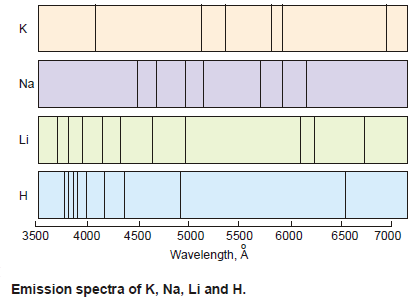
– Such a spectrum in which each line represents a specific wavelength of radiation emitted by the atoms is referred to as the Line spectrum or Atomic Emission spectrum of the element.
– The emission spectra of some elements are shown in the following figure.
– An individual line of these spectra is called a Spectral line.
– When white light composed of all visible wavelengths, is passed through the cool vapour of an element, certain wavelengths may be absorbed.
– These absorbed wavelengths are thus found missing in the transmitted light.
– The spectrum obtained in this way consists of a series of dark lines which is referred to as the Atomic Absorption spectrum or simply Absorption spectrum.
– Wavelengths of the dark lines are exactly the same as those of bright lines in the emission spectrum.
– The absorption spectrum of an element is the reverse of emission spectrum of the element.
– Atomic spectral lines are emitted or absorbed not only in the visible region of the electromagnetic spectrum but also in the infrared region (IR spectra) or in the ultraviolet region (UV spectra).
– Since the atomic spectra are produced by emission or absorption of energy depending on the internal structure of the atom, each element has its own characteristic spectrum.
– Today spectral analysis has become a powerful method for the detection of elements even though present in extremely small amounts.
– The most important consequence of the discovery of spectral lines of hydrogen and other elements was that it led to our present knowledge of atomic structure.
Atomic Spectrum of Hydrogen (Balmer Series)
– The emission line spectrum of hydrogen can be obtained by passing an electric discharge through the gas contained in a discharge tube at low pressure.
– The light radiation emitted is then examined with the help of a spectroscope.
– The bright lines recorded on the photographic plate constitute the atomic spectrum of hydrogen.
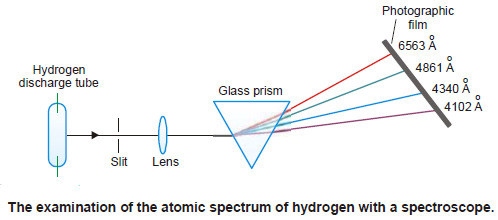
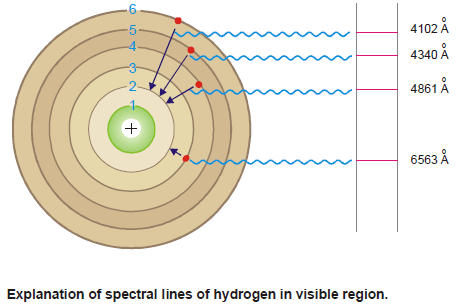
– In 1884 J.J. Balmer observed that there were four prominent coloured lines in the visible hydrogen spectrum:
- a red line with a wavelength of 6563 Å.
- a blue-green line with a wavelength of 4861 Å.
- a blue line with a wavelength of 4340 Å.
- a violet line with a wavelength of 4102 Å.
– The above series of four lines in the visible spectrum of hydrogen was named as the Balmer Series.
– By carefully studying the wavelengths of the observed lines, Balmer was able empirically to give an equation which related the wavelengths (λ) of the observed lines.
– The Balmer Equation is:

– R is a constant called the Rydberg Constant which has the value 109, 677 cm–1.
– n = 3, 4, 5, 6 etc.
– That is, if we substitute the values of 3, 4, 5 and 6 for n, we get, respectively, the wavelength of the four lines of the hydrogen spectrum.

– In addition to Balmer Series, four other spectral series were discovered in the infrared and ultraviolet regions of the hydrogen spectrum.
– These bear the names of the discoverers.
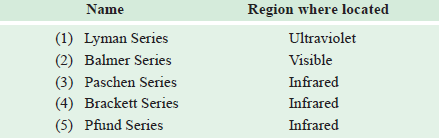
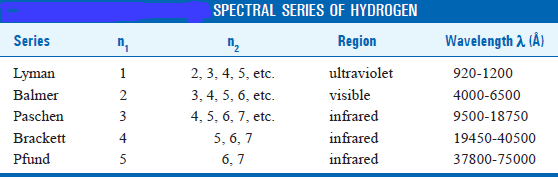
– Thus in all we have Five Spectral Series in the atomic spectrum of hydrogen:
– Balmer equation had no theoretical basis at all.
– Nobody had any idea how it worked so accurately in finding the wavelengths of the spectral lines of hydrogen atom.
– However, in 1913 Bohr put forward his theory which immediately explained the observed hydrogen atom spectrum.
Bohr’s Explanation of the Atomic Spectrum of Hydrogen
– The solitary electron in hydrogen atom at ordinary temperature resides in the first orbit (n = 1) and is in the lowest energy state (ground state).
– When energy is supplied to hydrogen gas in the discharge tube, the electron moves to higher energy levels viz., 2, 3, 4, 5, 6, 7, etc., depending on the quantity of energy absorbed.
– From these high energy levels, the electron returns by jumps to one or other lower energy level.
– In doing so the electron emits the excess energy as a photon.
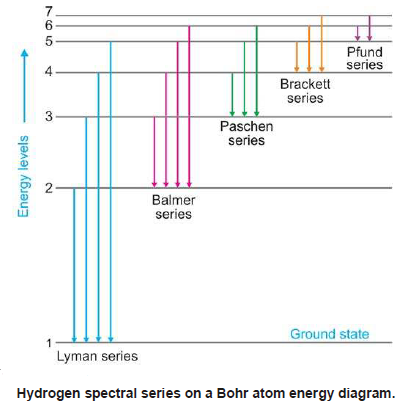
– This gives an excellent explanation of the various spectral series of hydrogen.
Lyman series is obtained when the electron returns to the ground state i.e., n = 1 from higher energy levels (n2 = 2, 3, 4, 5, etc.).
– Similarly, Balmer, Paschen, Brackett and Pfund series are produced when the electron returns to the second, third, fourth and fifth energy levels respectively as shown in the following figure:
– The value of Rydberg’s constant is the same as in the original empirical Balmer’s equation.
– According to equation (1), the energy of the electron in orbit n1 (lower) and n2(higher) is:

– The difference of energy between the levels n1 and n2is :

– According to Planck’s equation:

– where λ is the wavelength of photon and (c) is the velocity of light.
– From equation (1) and (2), we can write:
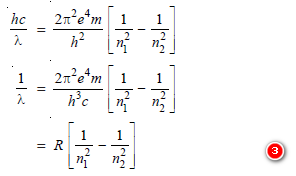
– where R is Rydberg constant.
– The value of R can be calculated as the value of (e, m, h and c) are known.
– It comes out to be 109,679 cm–1 and agrees closely with the value of Rydberg constant in the original empirical Balmer’s equation (109,677 cm–1).
Calculation of wavelengths of the spectral lines of Hydrogen in the visible region:
– These lines constitute the Balmer series when n1 = 2.
– Now the equation (3) above can be written as:

– Thus the wavelengths of the photons emitted as the electron returns from energy levels 6, 5, 4 and 3 were calculated by Bohr.
– The calculated values corresponded exactly to the values of wavelengths of the spectral lines already known.
– This was, in fact, a great success of the Bohr atom.
Solved Problem
Find the wavelength in Å of the line in Balmer series that is associated with drop of the electron from the fourth orbit. The value of Rydberg constant is 109,676 cm–1.
Solution
– The wavelengths of lines in the Balmer series are given by:

– where λ = wavelength, R (Rydberg constant) = 109,676 cm–1; n = 4.

– The wavelength of the spectral line is 6561 Å
Shortcomings of The Bohr Atom
(1) The great success of the Bohr theory was in its ability to predict lines in the hydrogen atom spectrum.
– But it was spectacularly unsuccessful for every other atom containing more than one electron.
(2) We no longer believe in well-defined electron orbits as was assumed by Bohr.
– In fact, in view of modern advances, like dual nature of matter, uncertainty principle, any mechanical model of the atom stands rejected.
(3) Bohr’s model of electronic structure could not account for the ability of atoms to form molecules through chemical bonds.
– Today we only accept Bohr’s views regarding quantization as nobody has explained atomic spectra without numerical quantization and no longer attempted description of atoms on classical mechanics.
(4) Bohr’s theory could not explain the effect of magnetic field (Zeeman effect) and electric field (Stark effect) on the spectra of atoms.
Sommerfeld’s Modification of Bohr Atom
– When spectra were examined with spectrometers, each line was found to consist of several closely packed lines.
– The existence of these multiple spectral lines could not be explained on the basis of Bohr’s theory.
– Sommerfeld modified Bohr’s theory as follows.
– Bohr considered electron orbits as circular but Sommerfeld postulated the presence of elliptic orbits also.
– An ellipse has a major and minor axis.
– A circle is a special case of an ellipse with equal major and minor axis.
– The angular momentum of an electron moving in an elliptic orbit is also supposed to be quantized.
– Thus only a definite set of values is permissible.
– It is further assumed that the angular momentum can be an integral part of (h/2π) units, where h is Planck’s constant. Or that,

– where (k) is called the azimuthal quantum number, whereas the quantum number used in Bohr’s theory is called the principal quantum number.
– The two quantum numbers n and k are related by the expression:
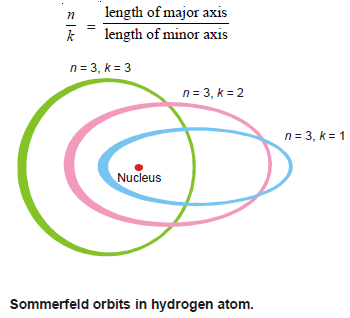
– The values of (k) for a given value of (n) are k = n – 1, n – 2, n – 3 and so on.
– A series of elliptic orbits with different eccentricities result for the different values of k.
– When n = k, the orbit will be circular.
– In other words (k) will have (n) possible values (n to 1) for a given value of (n).
– However, calculations based on wave mechanics have shown that this is incorrect and Sommerfeld’s modification of the Bohr atom fell through.
Reference: Essentials of Physical Chemistry /Arun Bahl, B.S Bahl and G.D. Tuli / multicolour edition.