
Carbon-13 NMR Spectroscopy
– In this topic, we will discuss The Carbon-13 NMR Spectroscopy.
Carbon-13 NMR Spectroscopy
– Where does a carbonyl group absorb in the NMR? Where does an internal alkyne absorb?
– In the proton NMR, both of these groups are invisible. Sometimes we can infer their presence: If the carbonyl group has a proton attached (an aldehyde proton), the peak between δ 9 and δ 10 alerts us to its presence.
– If the adjacent carbon atom has hydrogens, their signals between δ 2.1 and δ 2.5 are suggestive, but we still can’t see the carbonyl group.
– An internal alkyne is even more difficult, because there are no distinctive absorptions in the proton NMR and usually none in the IR either.
– The development of Fourier transform NMR spectroscopy made carbon NMR (13C NMR or CMR) possible, and high-field superconducting spectrometers allowed it to become nearly as convenient as proton NMR (13C NMR).
– Carbon NMR determines the magnetic environments of the carbon atoms themselves.
– Carbonyl carbon atoms, alkyne carbon atoms, and aromatic carbon atoms all have characteristic chemical shifts in the 13C NMR spectrum.
Sensitivity of Carbon-13 NMR
– Carbon NMR took longer than proton NMR to become a routine technique because carbon NMR signals are much weaker than proton signals, and the electronics in the early instruments could not detect the weak carbon signal.
– About 99% of the carbon atoms in a natural sample are the 12C isotope.
– This isotope has an even number of protons and an even number of neutrons, so it has no magnetic spin and cannot give rise to NMR signals.
– The less abundant isotope 13C has an odd number of neutrons, giving it a magnetic spin of 1/2, just like a proton.
– Because only 1% of the carbon atoms in a sample are the magnetic 13C isotope, the sensitivity of 13C NMR is decreased by a factor of 100.
– In addition, the gyromagnetic ratio of 13C is only one fourth that of the proton, so the 13C resonance frequency (at a given magnetic field) is only one fourth of that for 1H NMR.
– The smaller gyromagnetic ratio leads to a further decrease in sensitivity.
– Because 13C NMR is less sensitive than 1H NMR, special techniques are needed to obtain a spectrum.
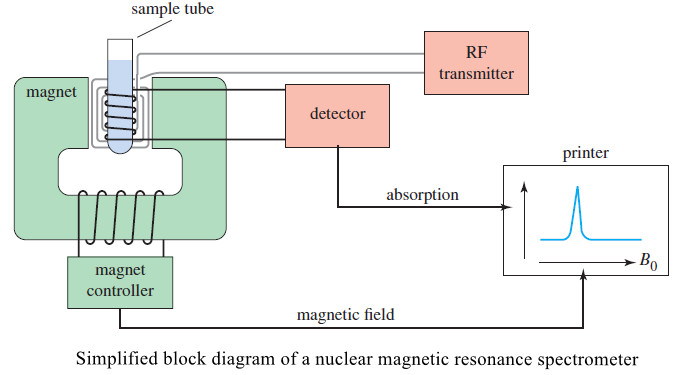
– The original type of NMR spectrometer shown in the following Figure (called a CW or continuous wave spectrometer) produces 13C signals that are very weak and become lost in the noise.
– When many spectra are averaged, however, the random noise tends to cancel while the desired signals are reinforced.
– If several spectra are taken and stored in a computer, they can be averaged and the accumulated spectrum plotted by the computer.
– Since the 13C NMR technique is much less sensitive than 1H NMR the technique, hundreds of spectra are commonly averaged to produce a usable result.
– Several minutes are required to scan each CW spectrum, and this averaging procedure is long and tedious. Fortunately, there is a better way.
Fourier Transform NMR Spectroscopy
– When magnetic nuclei are placed in a uniform magnetic field and irradiated with a pulse of radio frequency close to their resonant frequency, the nuclei absorb some of the energy and precess like little tops at their resonant frequencies (Figure 1).
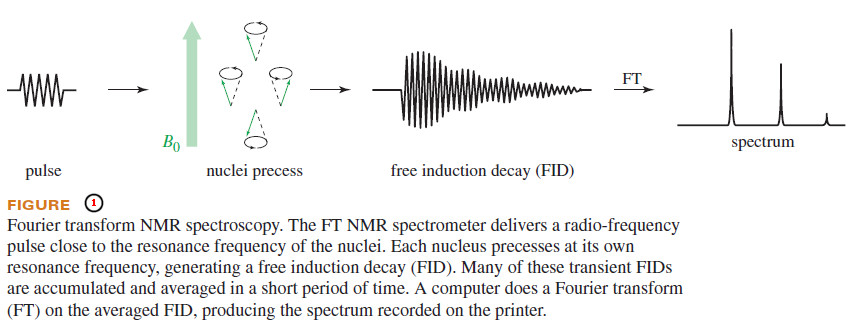
– This precession of many nuclei at slightly different frequencies produces a complex signal that decays as the nuclei lose the energy they gained from the pulse.
– This signal is called a free induction decay (or transient) and it contains all the information needed to calculate a spectrum.
– The free induction decay (FID) can be recorded by a radio receiver and a computer in 1 to 2 seconds, and many FIDs can be averaged in a few minutes.
– A computer converts the averaged transients into a spectrum.
– A Fourier transform is the mathematical technique used to compute the spectrum from the free induction decay, and this technique of using pulses and collecting transients is called Fourier transform spectroscopy.
– A Fourier transform spectrometer requires sophisticated electronics capable of generating precise pulses and accurately receiving the complicated transients.
– A good 13C NMR instrument usually has the capability to do 1H NMR spectra as well.
– When used with proton spectroscopy, the Fourier transform technique produces good spectra with very small amounts (less than a milligram) of sample.
Carbon Chemical Shifts
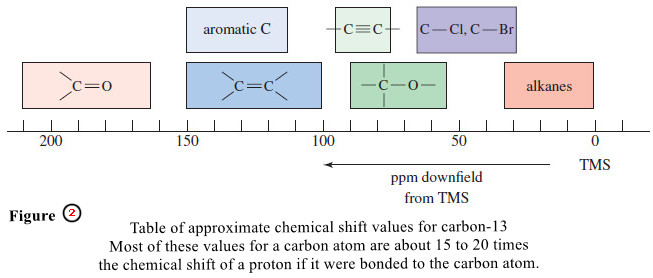
– Figure (2) gives typical ranges of chemical shifts for carbon atoms in organic molecules.
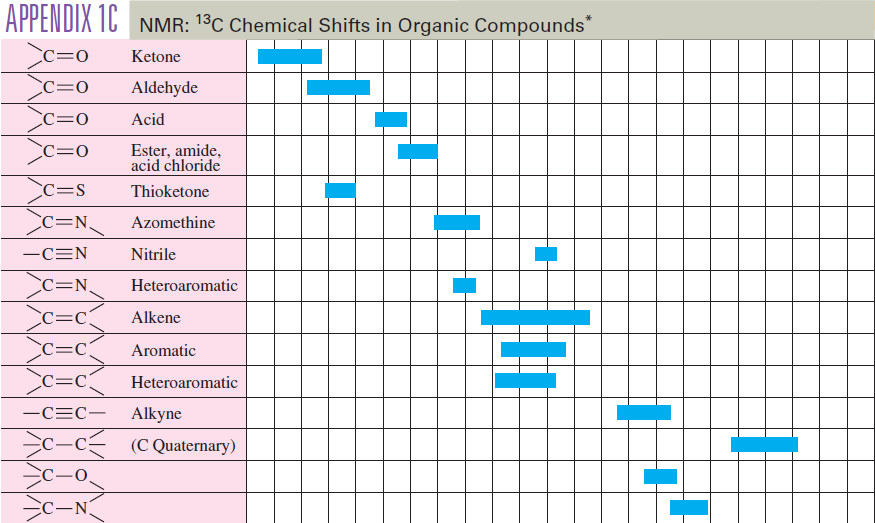
– A more detailed table of carbon chemical shifts is provided in the following table:
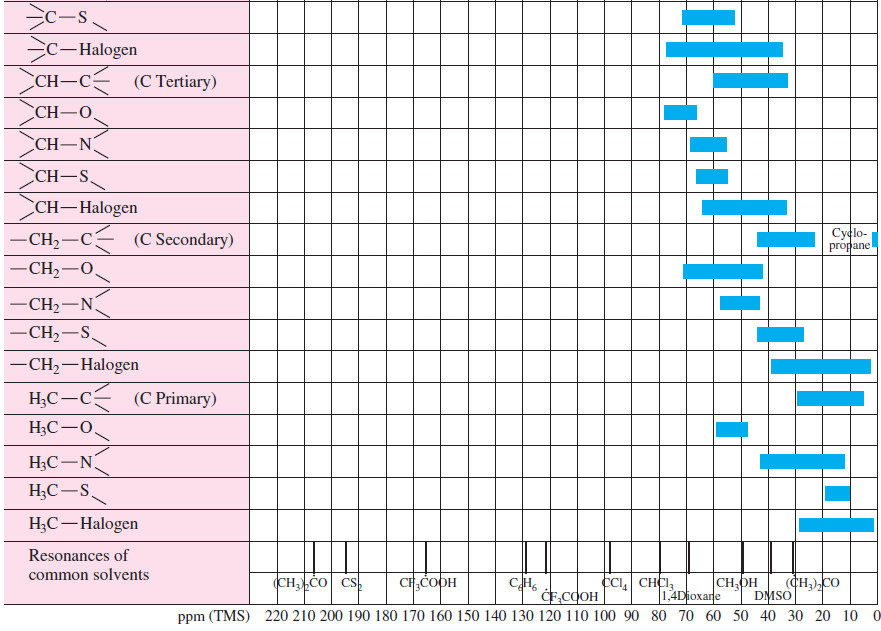
– As in proton NMR, many 13C signals are deshielded by electron-withdrawing substituents.
– Carbon chemical shifts are usually about 15 to 20 times larger than comparable proton chemical shifts, which makes sense because the carbon atom is one atom closer to a shielding or deshielding group than its attached hydrogen.
– For example, an aldehyde proton absorbs around δ 9.4 in the 1H NMR spectrum, and the carbonyl carbon atom absorbs around 180 ppm downfield from TMS in the 13C spectrum.
– Figure (3) compares the proton and carbon spectra of a complex aldehyde to show this relationship between proton and carbon chemical shifts.
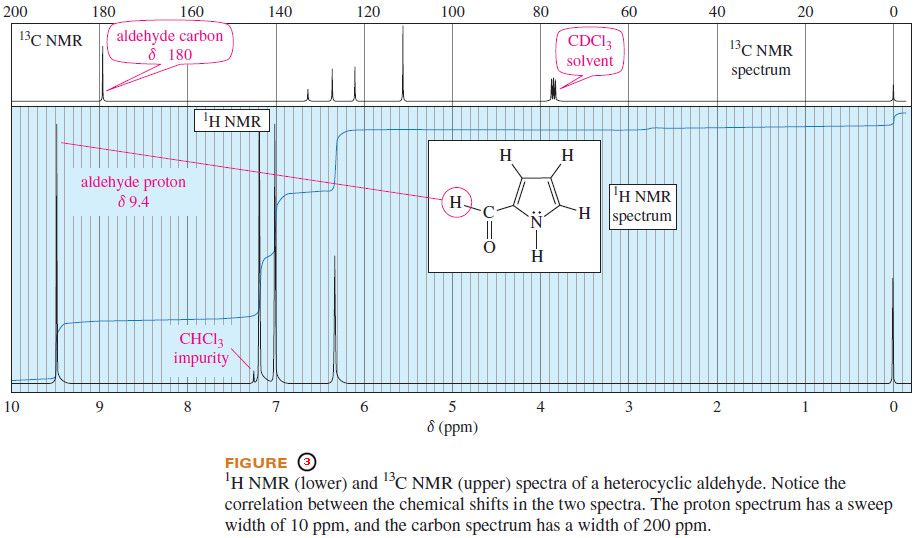
– The proton (lower) and carbon (upper) spectra in Figure (3) are calibrated so the full width of the proton spectrum is 10 ppm, while the width of the 13C spectrum is 200 ppm (20 times as large).
– Notice how the corresponding peaks in the two spectra almost line up vertically.
– This proportionality between 13C NMR and 1H NMR chemical shifts is an approximation that allows us to make a first estimate of a carbon atom’s chemical shift.
– For example, the peak for the aldehyde proton is at δ 9.5 in the proton spectrum, so we expect the peak for the aldehyde carbon to appear at a chemical shift between 15 and 20 times as large (between δ 144 and δ 192) in the carbon spectrum. The actual position is at δ 180.
– Notice also the triplet at δ 77 in the 13C NMR spectrum in Figure (3).
– This is the carbon signal for deuterated chloroform (CDCl3) split into three equal-sized peaks by coupling with the deuterium atom.
– Chloroform-d (CDCl3) is a common solvent for 13C NMR because the spectrometer can “lock” onto the signal from deuterium at a different frequency from carbon.
– The CDCl3 solvent signal is a common feature of carbon NMR spectra, and it can be used as an internal reference instead of TMS if desired.
– Because chemical shift effects are larger in 13C NMR, an electron-withdrawing group has a substantial effect on the chemical shift of a carbon atom beta (one carbon removed) to the group.
– For example, Figure (4) shows the 1H NMR and 13C NMR spectra of 1,2,2-trichloropropane.
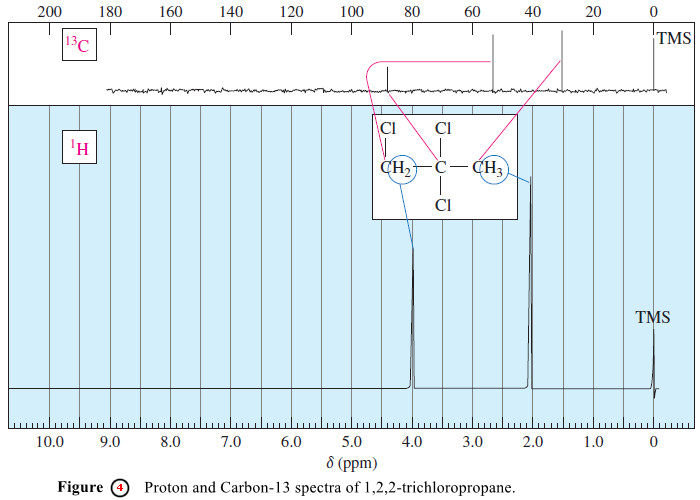
– The methyl (CH3) carbon absorbs at 33 ppm downfield from TMS because the two chlorine atoms on the adjacent -CCl2– carbon have a substantial effect on the methyl carbon.
– The chemical shift of this methyl carbon is about 15 times that of its attached protons δ 2.1, in accordance with our prediction.
– Similarly, the chemical shift of the -CH2Cl carbon (56 ppm) is about 15 times that of its protons δ 4.0.
– Although the CCl2 carbon has no protons, the proton in a -CHCl2 group generally absorbs around δ 5.8 .The carbon absorption at 87 ppm is about 15 times this proton shift.
Important Differences Between Proton and Carbon-13 Techniques
– Most of the characteristics of Carbon-13 NMR spectroscopy are similar to those of 1H NMR the technique.
– There are some important differences, however.
Operating Frequency
– The gyromagnetic ratio for 13C is about one-fourth that of the proton, so the resonance frequency is also about one-fourth.
– A spectrometer with a 70,459-gauss magnet needs a 300-MHz transmitter for protons and a 75.6 MHz transmitter for 13C.
– A spectrometer with a 14,092-gauss magnet needs a 60-MHz transmitter for protons and a 15.1-MHz transmitter for 13C.
Peak Areas
– The areas of 13C NMR peaks are not necessarily proportional to the number of carbons giving rise to the peaks.
– Carbon atoms with two or three protons attached usually give the strongest absorptions, and carbons with no protons tend to give weak absorptions.
– Newer spectrometers have an integrating mode that uses decoupling techniques to equalize the absorptions of different carbon atoms.
– This mode makes peak integrals nearly proportional to the relative numbers of carbon atoms.
Spin-Spin Splitting in Carbon-13 NMR Spectroscopy
– Carbon-13 NMR splitting patterns are quite different from those observed in 1H NMR .
– Only 1% of the carbon atoms in the 13C NMR sample are magnetic, so there is only a small probability that an observed 13C nucleus is adjacent to another 13C nucleus.
– Therefore, carbon–carbon splitting can be ignored. Carbon–hydrogen coupling is common, however.
– Most carbon atoms are bonded directly to hydrogen atoms or are sufficiently close to hydrogen atoms for carbon–hydrogen spin-spin coupling to be observed.
– Extensive carbon–hydrogen coupling produces splitting patterns that can be complicated and difficult to interpret.
Proton Spin Decoupling
– To simplify Carbon-13 NMR spectra, they are commonly recorded using proton spin decoupling, where the protons are continuously irradiated with a broadband (“noise”) proton transmitter.
– As a result, all the protons are continuously in resonance, and they rapidly flip their spins.
– The carbon nuclei see an average of the possible combinations of proton spin states.
– Each carbon signal appears as a single, unsplit peak because any carbon–hydrogen splitting has been eliminated.
– The spectra in Figures (3) and (4) were generated in this manner.
Off-Resonance Decoupling
– Proton spin decoupling produces spectra that are very simple, but some valuable information is lost in the process.
– Off-resonance decoupling simplifies the spectrum but allows some of the splitting information to be retained (Figure 5).
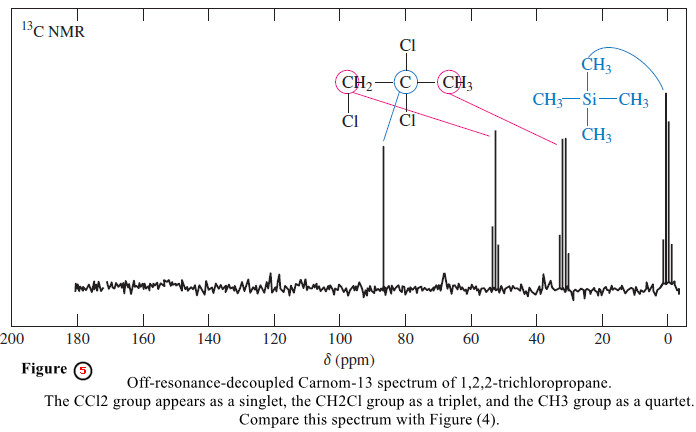
– With off-resonance decoupling, the 13C nuclei are split only by the protons directly bonded to them.
– The N+1 rule applies, so a carbon atom with one proton (a methine) appears as a doublet, a carbon with two attached protons (a methylene) gives a triplet, and a methyl carbon is split into a quartet.
– Off-resonance-decoupled spectra are easily recognized by the appearance of TMS as a quartet at 0 ppm, split by the three protons of each methyl group.
– The best procedure for obtaining a 13C NMR spectrum is to run the spectrum twice: The singlets in the broadband-decoupled spectrum indicate the number of nonequivalent types of carbon atoms and their chemical shifts.
– The multiplicities of the signals in the off-resonance-decoupled spectrum indicate the number of hydrogen atoms bonded to each carbon atom.
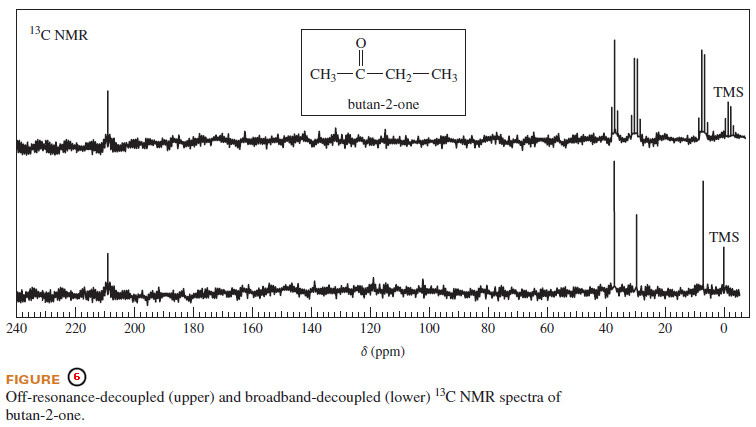
– Carbon-13 spectra are often given with two traces, one broadband decoupled and the other off-resonance decoupled.
– If just one trace is given, it is usually broadband decoupled.
– Figure (6) shows both spectra for butan-2-one.
DEPT Carbon-13 NMR Spectroscopy
– DEPT (Distortionless Enhanced Polarization Transfer) is a more recent technique that provides the same information as off-resonance decoupling.
– DEPT is easier to run on modern, computer-controlled Fourier transform spectrometers.
– DEPT gives better sensitivity, and it avoids overlapping multiplets because all the peaks remain decoupled singlets.
– Each 13C nucleus is magnetically coupled to the protons bonded to it.
– Under the right circumstances, this magnetic coupling allows the transfer of polarization from the protons to the carbon nucleus.
– The number of protons bonded to the 13C nucleus determines how this polarization transfer occurs.
– A DEPT experiment usually includes three spectral scans:
(1) The normal decoupled scan, in which each type of 13C nucleus appears as a singlet.
(2) The DEPT-90 scan, in which only the CH (methine) carbons bonded to exactly one proton appear.
(3) The DEPT-135 scan, in which the CH3 (methyl) groups and CH (methine) groups appear normally, and the CH2 groups give negative peaks.
– Carbons that are bonded to no protons do not appear.
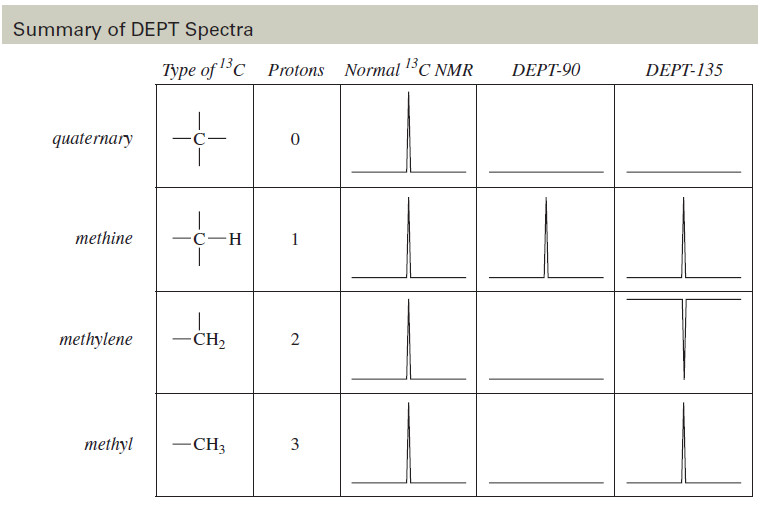
– As shown graphically in the following Table, this information allows us to distinguish among carbons bonded to 0, 1, 2, or 3 hydrogen atoms:
(1) Carbons with no H’s appear only in the normal spectrum, but not in either DEPT spectrum.
(2) Methine carbons (CH) give normal positive peaks in all three spectra.
(3) Methylene (CH2) carbons give normal peaks in the normal spectrum, no peaks in the DEPT-90 spectrum, and negative peaks in the DEPT-135 spectrum.
(4) Methyl (CH3) carbons give normal peaks in the normal spectrum, no peaks in the DEPT-90 spectrum, and normal peaks in the DEPT-135 spectrum.
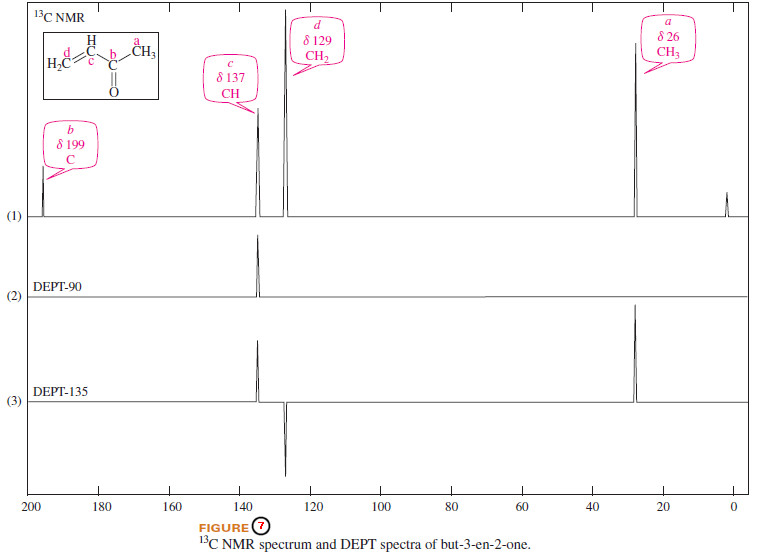
– Figure (7) shows the normal decoupled Carbon-13 NMR spectrum of but-3-en-2-one (1), plus the DEPT 90 spectrum (2), and the DEPT-135 spectrum (3).
– Note that the carbonyl carbon (Cb, no protons) appears only in the regular spectrum. Cc,with 1 proton, appears normally in all the spectra. Cd,with two protons, appears as a negative peak in the DEPT-135 spectrum. Ca,the methyl carbon with three protons, vanishes in the DEPT-90 spectrum but appears as a normal peak in the DEPT-135 spectrum.
Summary of DEPT Spectra
References:
- Organic chemistry / L.G. Wade, Jr / 8th ed, 2013 / Pearson Education, Inc. USA.
- Fundamental of Organic Chemistry / John McMurry, Cornell University/ 8th ed, 2016 / Cengage Learningm, Inc. USA.
- Organic Chemistry / T.W. Graham Solomons, Craig B. Fryhle , Scott A. Snyder / 11 ed, 2014/ John Wiley & Sons, Inc. USA.


 and Silyl Ethers")
