Mass Spectrometry : Introduction
Mass spectrometry (MS) provides the molecular weight and valuable information about the molecular formula, using a very small sample.
Introduction to Mass Spectrometry
– Infrared spectroscopy gives information about the functional groups in a molecule, but it tells little about the size of the molecule or what heteroatoms are present.
– To determine a structure, we need a molecular weight and a molecular formula.
– Molecular formulas were once obtained by careful analysis of the elemental composition and molecular weight was determined by freezing-point depression or some other difficult technique.
– These are long and tedious processes, and they require a large amount of pure material. Many important compounds are available only in small quantities, and they may be impure.
– Mass spectrometry (MS) provides the molecular weight and valuable information about the molecular formula, using a very small sample.
– High-resolution mass spectrometry (HRMS) can provide an accurate molecular formula, even for an impure sample.
– The mass spectrum also provides structural information that can confirm a structure derived from NMR and IR spectroscopy.
– Mass spectrometry is fundamentally different from spectroscopy. Spectroscopy involves the absorption (or emission) of light over a range of wavelengths.
– Mass spectrometry does not use light at all. In the mass spectrometer, a sample is struck by high-energy electrons, breaking the molecules apart.
– The masses of the fragments are measured, and this information is used to reconstruct the molecule.
– The process is similar to analyzing a vase by shooting it with a rifle and then weighing all the pieces.
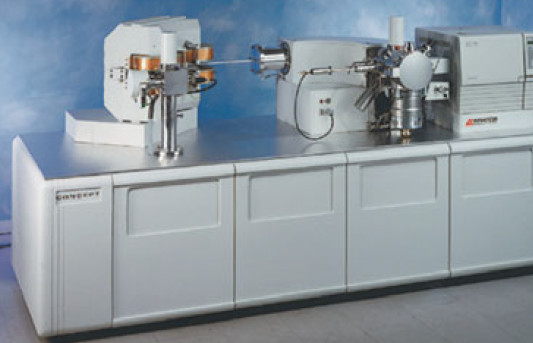
(1) The Mass Spectrometer
– A mass spectrometer ionizes molecules in a high vacuum, sorts the ions according to their masses, and records the abundance of ions of each mass.
– A mass spectrum is a graph plotted by the mass spectrometer, with the masses plotted as the x-axis and the relative number of ions of each mass on the y-axis.
– Several methods are used to ionize samples and then to separate ions according to their masses.
– We will emphasize the most common techniques, electron impact ionization for forming the ions, and magnetic deflection for separating the ions.
Electron Impact Ionization
– In the ion source, the sample is bombarded by a beam of electrons.
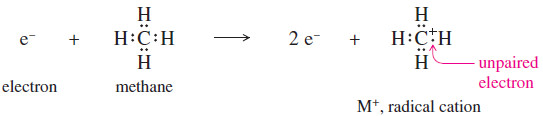
– When an electron strikes a neutral molecule, it may ionize that molecule by knocking out an additional electron.
![]()
– When a molecule loses one electron, it then has a positive charge and one unpaired electron. The ion is therefore a radical cation.
– The electron impact ionization of methane is shown next.
– Most carbocations have a three-bonded carbon atom with six paired electrons in its
valence shell.
– The radical cation just shown is not a normal carbocation. The carbon atom has seven electrons around it, and they bond it to four other atoms.
– This unusual cation is represented by the formula ![]() , with + indicating the positive charge and the . indicating the unpaired electron.
, with + indicating the positive charge and the . indicating the unpaired electron.
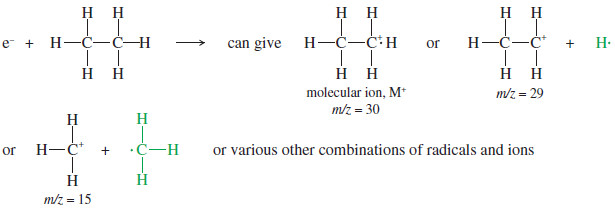
– In addition to ionizing a molecule, the impact of an energetic electron may break it apart.
– This fragmentation process gives a characteristic mixture of ions.
– The radical cation corresponding to the mass of the original molecule is called the molecular ion, abbreviated M+.
– The ions of smaller molecular weights are called fragments.
– Bombardment of ethane molecules by energetic electrons, for example, produces the molecular ion and several fragments.
-Both charged and uncharged fragments are formed, but only the positively charged fragments are detected by the mass spectrometer.
– We will often use green type for the (invisible) uncharged fragments.
Separation of Ions of Different Masses
– Once ionization and fragmentation have formed a mixture of ions, these ions are separated and detected.
– The most common type of mass spectrometer shown in the next Figure, separates ions by magnetic deflection.
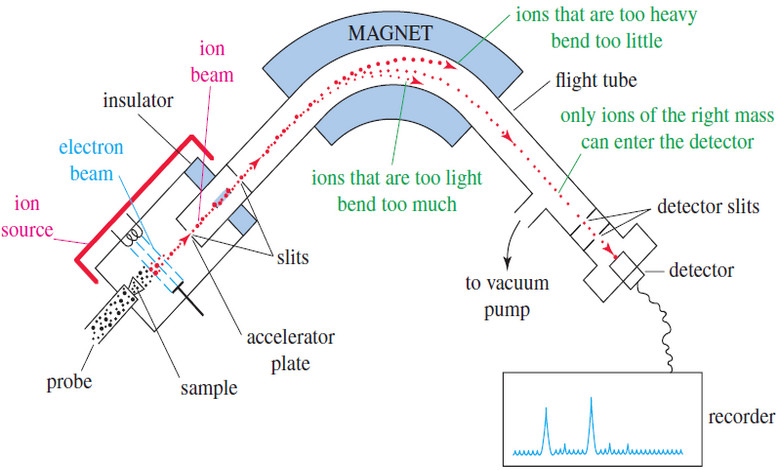
– After ionization, the positively charged ions are attracted to a negatively charged accelerator plate, which has a narrow slit to allow some of the ions to pass through.
– The ion beam enters an evacuated flight tube, with a curved portion positioned between the poles of a large magnet.
– When a charged particle passes through a magnetic field, a transverse force bends its path.
– The path of a heavier ion bends less than the path of a lighter ion.
– The exact radius of curvature of an ion’s path depends on its mass-to-charge ratio, symbolized by m/z (or by m/e in the older literature).
– In this expression, m is the mass of the ion (in amu) and z is its charge in units of the electronic charge.
– The vast majority of ions have a charge of +1, so we consider their path to be curved by an amount that depends only on their mass.
– At the end of the flight tube is another slit, followed by an ion detector connected to an amplifier.
– At any given magnetic field, only ions of one particular mass are bent exactly the right amount to pass through the slit and enter the detector.
– The detector signal is proportional to the number of ions striking it.
– By varying the magnetic field, the spectrometer scans through all the possible ion masses and produces a graph of the number of ions of each mass.
(2) The Mass Spectrum
– The mass spectrometer usually plots the spectrum as a graph on a computer screen.
– This information is tabulated, and the spectrum is printed as a bar graph or as a table of relative abundances (see Figure):
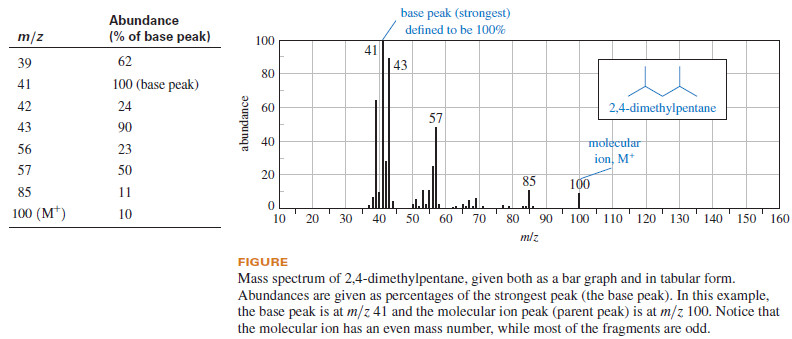
– In the printed mass spectrum, all the masses are rounded to the nearest whole-number mass unit.
– The peaks are assigned abundances as percentages of the strongest peak, called the base peak.
– Notice that the base peak does not necessarily correspond to the mass of the molecular ion.
– It is simply the strongest peak, making it easy for other peaks to be expressed as percentages.
– A molecular ion peak (also called the parent peak) is observed in most mass spectra, meaning that a detectable number of molecular ions (M+) reach the detector without fragmenting.
– These molecular ions are usually the particles of the highest mass in the spectrum and (for compounds not containing nitrogen) the molecular ion usually has an even-numbered mass.
– The value of m/z for the molecular ion immediately gives the molecular weight of the compound.
– If no molecular ion peak is observed in the standard mass spectrum, the operator can use a gentler ionization.
– The energy of the electron beam can be decreased from the typical 70 electron volts (eV) to 20–25 eV, where much less fragmentation occurs.
(3) Mass Spectrometry of Mixtures: The GC–MS
– Mass spectrometry is combined with gas chromatography for routine analysis of mixtures of compounds, such as reaction mixtures or environmental samples.
– The following Figure shows a simplified diagram of a common type of GC–MS.
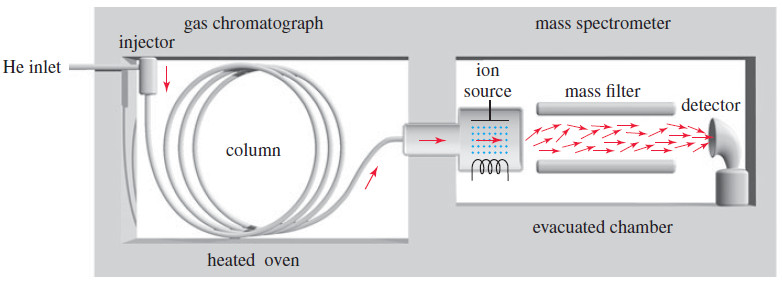
– The gas chromatograph uses a heated capillary column coated on the inside with silicone rubber (or other stationary phase) to separate the components of the mixture.
– A small amount of sample (about 10-6 grams is enough) is injected into a heated injector, where a gentle flow of helium sweeps it into the column.
– As the sample passes through the column, the more volatile components (that interact less with the stationary phase) move through the column faster than the less volatile components.
– The separated components leave the column at different times, passing through a transfer line into the ion source of the mass spectrometer, where the molecules are ionized and allowed to fragment.
– Most gas chromatograph-mass spectrometer systems use a quadrupole mass filter to separate the ions.
– In a high vacuum, the ions pass down the length of four rods, which have varying voltages applied to them. (The figure above shows two of the four rods.)
– The varying electric fields cause the ions to follow complex orbits, and only one mass reaches the detector at any instant.
– By scanning the voltages, a wide range of masses can be measured in less than 1 second.
– In this way, many mass spectra are taken and stored on a computer disk as the components of the sample pass from the chromatograph column into the mass spectrometer.
– This powerful GC–MS combination allows many components of a mixture to be separated by the gas chromatograph and later identified by their mass spectra.