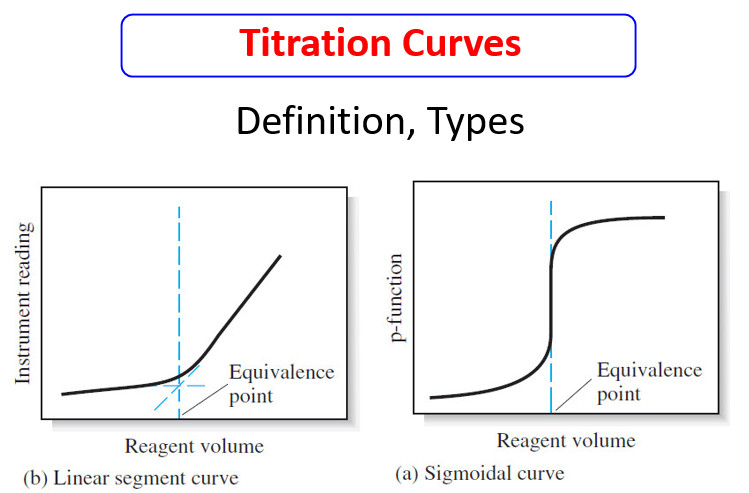
Titration of Strong Acids and Bases
– In this topic, we will discuss The Titration of Strong Acids and Bases.
Introduction to Titration of Strong Acids and Bases
– The hydronium ions in an aqueous solution of a strong acid have two sources:
(1) the reaction of the acid with water.
(2) the dissociation of water itself.
– In all but the most dilute solutions, however, the contribution from the strong acid far exceeds that from the solvent.
– Thus, for a solution of HCl with a concentration greater than about 10-6 M, we can write
![]()
– where [OH–] represents the contribution of hydronium ions from the dissociation of water.
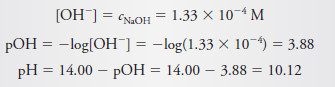
– An analogous relationship applies for a solution of a strong base, such as sodium hydroxide. That is,
![]()
Titration of a Strong Acid with a Strong Base
– We will be interested in this topic and in the next several, in calculating hypothetical titration curves of pH vs. volume of titrant.
– We must make a clear distinction between the curves constructed by computing the values of pH and the experimental titration curves that we observe in the laboratory.
– Three types of calculations must be done in order to construct the hypothetical curve for titrating a solution of a strong acid with a strong base.
– Each of these types corresponds to a distinct stage in the titration:
(1) preequivalence.
(2) equivalence.
(3) postequivalence.
– In the preequivalence stage, we compute the concentration of the acid from its starting concentration and the amount of base added.
– At the equivalence point, the hydronium and hydroxide ions are present in equal concentrations, and the hydronium ion concentration can be calculated directly from the ion-product constant for water, Kw.
– In the postequivalence stage, the analytical concentration of the excess base is computed, and the hydroxide ion concentration is assumed to be equal to or a multiple of the analytical concentration.
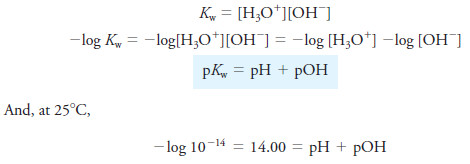
– A convenient way of converting hydroxide concentration to pH can be developed by taking the negative logarithm of both sides of the ion-product constant expression for water. Thus,
Titration curve for the titrating Strong Acid with a Strong Base
Example (1):
Generate the hypothetical titration curve for the titration of 50.00 mL of 0.0500 M HCl with 0.1000 M NaOH at 25°C.
Initial Point
– Before any base is added, the solution is 0.0500 M in H3O+, and
![]()
After Addition of 10.00 mL of Reagent
– The hydronium ion concentration is decreased as a result of both reaction with the base and dilution.
– So, the remaining HCl concentration, cHCl, is
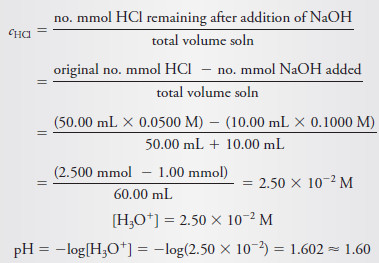
– Note that we usually compute pH to two decimal places in titration curve calculations.
– We calculate additional points defining the curve in the region before the equivalence point in the same way.
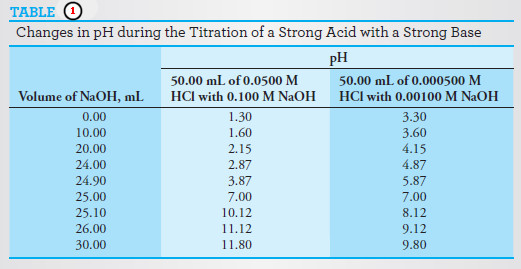
– The results of these calculations are shown in the second column of the following Table.
After Addition of 25.00 mL of Reagent: The Equivalence Point
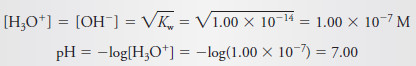
– At the equivalence point, neither HCl nor NaOH is in excess, and so, the concentrations of hydronium and hydroxide ions must be equal.
– Substituting this equality into the ion-product constant for water yields
After Addition of 25.10 mL of Reagent
– The solution now contains an excess of NaOH, and we can write
– The equilibrium concentration of hydroxide ion is
– Additional values beyond the equivalence point are calculated in the same way.
– The results of these computations are shown in the last three rows of Table (1).
The Effect of Concentration
– The effects of reagent and analyte concentration on the neutralization titration curves for strong acids are shown by the two sets of data in Table (1) and the plots in the following Figure.
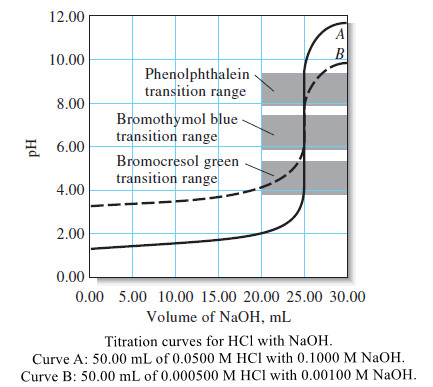
– Note that with 0.1 M NaOH as the titrant, the change in pH in the equivalence-point region is large.
– With 0.001 M NaOH, the change is much smaller, but still pronounced.
Choosing an Indicator
– The previous Figure shows that the selection of an indicator is not critical when the reagent concentration is approximately 0.1 M.
– In that case, the volume differences in titrations with the three indicators shown are of the same magnitude as the uncertainties associated with reading the buret and so are negligible.
– Note, however, that bromocresol green is unsuited for a titration involving the 0.001 M reagent because the color change occurs over a 5-mL range well before the equivalence point.
– The use of phenolphthalein is subject to similar objections.
– Of the three indicators, then, only bromothymol blue provides a satisfactory end point with a minimal systematic error in the titration of 0.001 M NaOH.
Titration of a Strong Base with a Strong Acid
– Titration curves for strong bases are calculated in a similar way to those for strong acids.
– Short of the equivalence point, the solution is basic, and the hydroxide ion concentration is numerically related to the analytical concentration of the base.
– The solution is neutral at the equivalence point and becomes acidic in the region beyond the equivalence point.
– After the equivalence point, the hydronium ion concentration is equal to the analytical concentration of the excess strong acid.
Titration curve for the titrating Strong Base with a Strong Acid
Example (2)
Calculate the pH during the titration of 50.00 mL of 0.0500 M NaOH with 0.1000 M HCl at 25°C after the addition of the following volumes of reagent: (a) 24.50 mL, (b) 25.00 mL, (c) 25.50 mL.
Solution
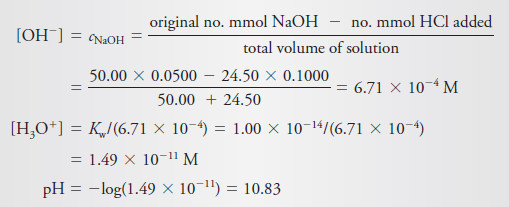
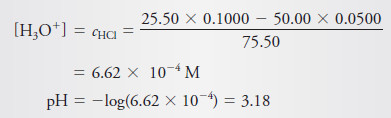
(a) At 24.50 mL added, [H3O+] is very small and cannot be computed from stoichiometric considerations but can be obtained from [OH–]:
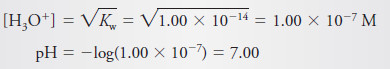
(b) 25.00 mL added is the equivalence point where [H3O+] = [OH–]:
(c) At 25.50 mL added
Curves for the titration of 0.0500 M and 0.00500 M NaOH with 0.1000 M and 0.0100 M HCl are shown in the following Figure.
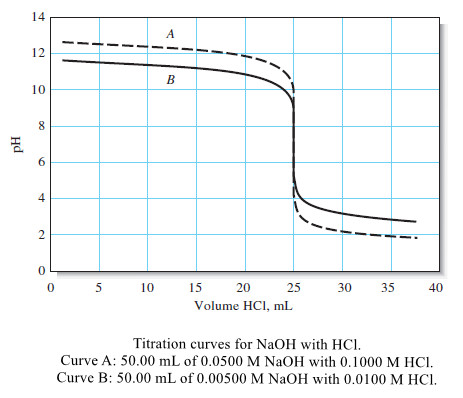
– We use the same criteria described for the titration of a strong acid with a strong base to select an indicator.
Significant Figures in Titration Curve Calculations
– Concentrations calculated in the equivalence-point region of titration curves are generally of low precision because they are based on small differences between large numbers.
– For example, in the calculation of cNaOH after introduction of 25.10 mL of NaOH in Example (1), the numerator (2.510 – 2.500 = 0.010) is known to only two significant figures.
– To minimize rounding error, however, three digits were retained in cNaOH (1.33 × 10⁻⁴), and rounding was postponed until pOH and pH were computed.
– To round the calculated values of p-functions, remember that it is the mantissa of a logarithm (that is, the number to the right of the decimal point) that should be rounded to include only significant figures because the characteristic (the number to the left of the decimal point) merely locates the decimal point.
– Fortunately, the large changes in p-functions characteristic of most equivalence points are not obscured by the limited precision of the calculated data.
– Generally, in calculating values for titration curves, we will round p-functions to two places to the right of the decimal point whether or not such rounding is called for.
Reference
- Modern analytical chemistry / David Harvey / The McGraw-Hill Companies, Inc./ , 2000 . USA
- Dean’s Analytical Chemistry Handbook / Pradyot Patnaik / The McGraw-Hill Companies, 2nd Editionm, 2004 .USA
- Fundamentals of analytical chemistry / Douglas A. Skoog, Donald M. West, F. James Holler, Stanley R. Crouch. (ninth edition) , 2014 . USA