Titration Curves for Weak Acids
Titration Curves for Weak Acids
– Four distinctly different types of calculations are needed to compute values for a weak acid (or a weak base) titration curves:
(1) At the beginning, the solution contains only a weak acid or a weak base, and the pH is calculated from the concentration of that solute and its dissociation
constant.
(2) After various increments of titrant have been added (up to, but not including, the equivalence point), the solution consists of a series of buffers.
– The pH of each buffer can be calculated from the analytical concentrations of the conjugate base or acid and the concentrations of the weak acid or base that remains.
(3) At the equivalence point, the solution contains only the conjugate of the weak acid or base being titrated (that is, a salt), and the pH is calculated from the concentration of this product.
(4) Beyond the equivalence point, the excess of strong acid or base titrant suppresses the acidic or basic character of the reaction product to such an extent that the pH is governed largely by the concentration of the excess titrant
– Titration curves for strong and weak acids are identical just slightly beyond the equivalence point. The same is true for strong and weak bases.
Example (1) for Titration Curves for Weak Acids
Generate a curve for the titration of 50.00 mL of 0.1000 M acetic acid (HOAc) with 0.1000 M sodium hydroxide at 25°C.
Initial pH
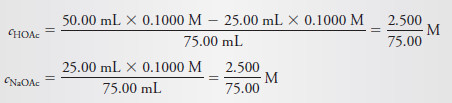
First, we must calculate the pH of a 0.1000 M solution of HOAc using the Equation:

pH after Addition of 10.00 mL of Reagent
– A buffer solution consisting of NaOAc and HOAc has now been produced.
– The analytical concentrations of the two constituents are
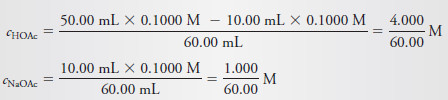
– Now, for the 10.00 mL volume, we substitute the concentrations of HOAc and OAc– into the dissociation-constant expression for acetic acid and obtain:

– Note that the total volume of solution is present in both numerator and denominator and thus cancels in the expression for [H3O+].
– Calculations similar to this provide points on the curve throughout the buffer region.
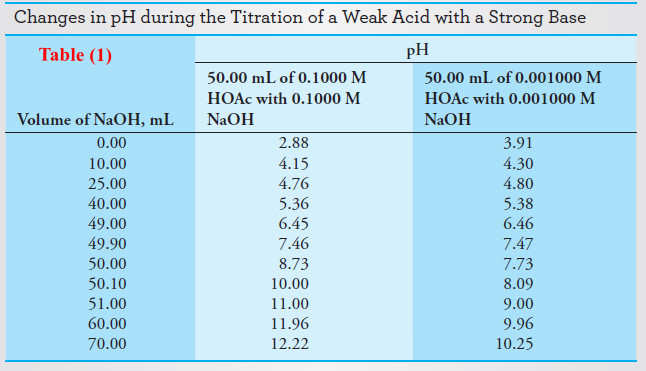
– Data from these calculations are presented in column 2 of Table 1.
pH after Addition of 25.00 mL of Reagent
– As in the previous calculation, the analytical concentrations of the two constituents are
– Now, for the 25.00 mL volume, we substitute the concentrations of HOAc and OAc– into the dissociation-constant expression for acetic acid and obtain
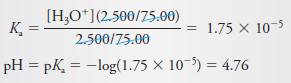
– At this half-titration point, the analytical concentrations of the acid and conjugate base cancel in the expression for [H3O+].
Equivalence-point pH
– At the equivalence point, all of the acetic acid has been converted to sodium acetate.
– The solution is, therefore, similar to one formed by dissolving NaOAc in water, and the pH calculation is identical to that shown solved proplem (5) for a weak base.
– In the present example, the NaOAc concentration is
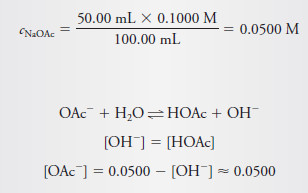
– Substituting these quantities into the base dissociation-constant expression for OAc– gives:

pH After Addition of 50.10 mL of Base
– After the addition of 50.10 mL of NaOH, the excess base and the acetate ion are both sources of hydroxide ion.
– The contribution from the acetate ion is small, however, because the excess of strong base suppresses the reaction of acetate with water.
– This fact becomes evident when we consider that the hydroxide ion concentration is only 5.34 × 10⁻⁶ M at the equivalence point; once a tiny excess of strong base is added, the contribution from the reaction of the acetate is even smaller.
– We have then

– Note that the titration curve for a weak acid with a strong base is identical with that for a strong acid with a strong base in the region slightly beyond the equivalence point.
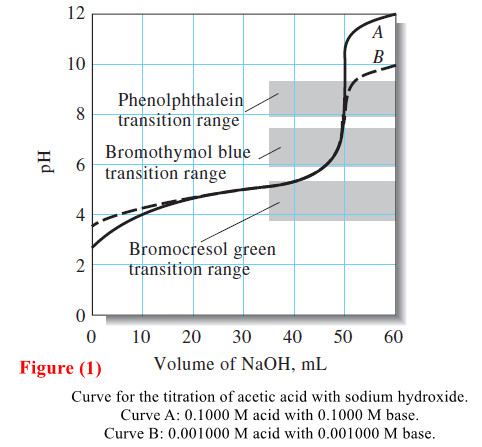
– Table (1) and Figure (1) compares the pH values calculated in this example with a more dilute titration.
– In a dilute solution, some of the assumptions made in this example do not hold.
Observation on Example (1)
– Note from Example (1) that the analytical concentrations of acid and conjugate base are identical when an acid has been half neutralized (after the addition of exactly 25.00 mL of base in this case).
– Thus, these terms cancel in the equilibrium-constant expression, and the hydronium ion concentration is numerically equal to the dissociation constant.
– Likewise, in the titration of a weak base, the hydroxide ion concentration is numerically equal to the dissociation constant of the base at the midpoint in the titration curves.
– In addition, the buffer capacities of each of the solutions are at a maximum at this point.
– These points, often called the half-titration points, are used to determine the dissociation constants.
– At the half-titration point in a weak-acid titration, [H3O+] = Ka, and pH = pKa.
– At the half-titration point in a weak-base titration, [OH–] = Kb , and pOH = pKb (recall Kb = Kw /Ka).
The Effect of Concentration
– The second and third columns of Table (1) contain pH data for the titration of 0.1000 M and of 0.001000 M acetic acid with sodium hydroxide solutions of the same two concentrations.
– In calculating the values for the more dilute acid, none of the approximations shown in Example (1) were valid, and solution of a quadratic equation was necessary for each point on the curve until after the equivalence point.
– In the postequivalence point region, the excess OH– predominates, and the simple calculation works nicely.
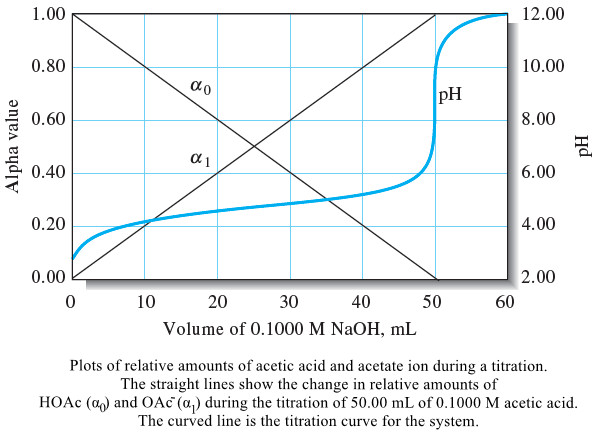
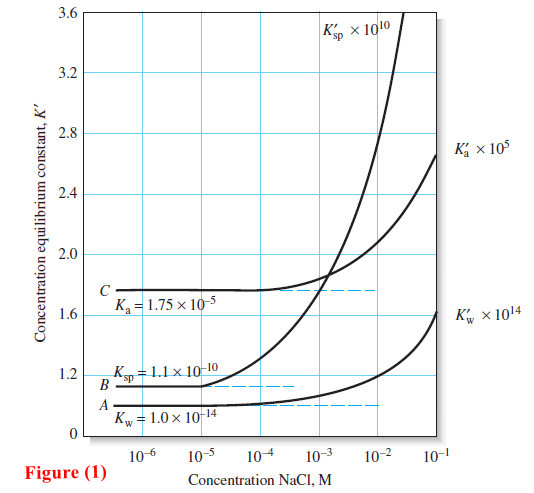
– Figure (1) is a plot of the data in Table (1) .
– Note that the initial pH values are higher and the equivalence-point pH is lower for the more dilute solution (Curve B).
– At intermediate titrant volumes, however, the pH values differ only slightly because of the buffering action of the acetic acid/sodium acetate system that is present in this region.
– Figure (1) is graphical confirmation that the pH of buffers is largely independent of dilution.
– Note that the change in [OH–] in the vicinity of the equivalence point becomes smaller with lower analyte and reagent concentrations.
– This effect is analogous to the effect for the titration of a strong acid with a strong base.
The Effect of Reaction Completeness
– Titration curves for 0.1000 M solutions of acids with different dissociation constants are shown in Figure 2.
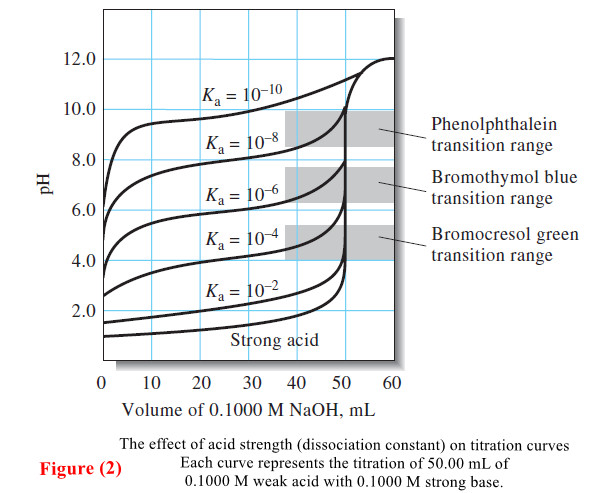
– Note that the pH change in the equivalence-point region becomes smaller as the acid becomes weaker—that is, as the reaction between the acid and the base becomes less complete.
Choosing an Indicator: The Feasibility of Titration
– Figures (1) and (2) show that the choice of indicator is more limited for the titration of a weak acid than for the titration of a strong acid.
– For example, Figure (1) illustrates that bromocresol green is totally unsuited for titration of 0.1000 M acetic acid.
– Bromothymol blue does not work either because its full color change occurs over a range of titrant volume from about 47 mL to 50 mL of 0.1000 M base.
– On the other hand, an indicator exhibiting a color change in the basic region, such as phenolphthalein, provides a sharp end point with a minimal titration error.
– The end-point pH change associated with the titration of 0.001000 M acetic acid (curve B, Figure 1) is so small that there is likely to be a significant titration error regardless of indicator.
– However, using an indicator with a transition range between that of phenolphthalein and that of bromothymol blue in conjunction with a suitable color comparison standard makes it possible to establish the end point in this titration with decent precision (a few percent relative standard deviation).
– Figure (2) illustrates that similar problems occur as the strength of the acid being titrated decreases.
– A precision on the order of ±2 ppt can be achieved by titrating a 0.1000 M solution of an acid with a dissociation constant of 10-8 if a suitable color comparison standard is available.
– With more concentrated solutions, weaker acids can be titrated with reasonable precision.
A Master Equation Approach to Weak Acid/Strong Base Titrations
– With a weak acid and strong base titrations, a single master equation is used to find the H3O+ concentration throughout the titration.
– As an example let us take the titration of a hypothetical weak acid, HA (dissociation constant, Ka), with strong base, NaOH.
– Consider VHA mL of c0HA M HA being titrated with c0NaOH M NaOH.
– At any point in the titration, we can write the charge balance equation as:
![]()
– We now substitute to obtain an equation for H3O+ as a function of the volume of NaOH added, VNaOH.
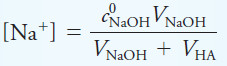
– We can express the sodium ion concentration as the number of millimoles of NaOH added divided by the total solution volume. Or
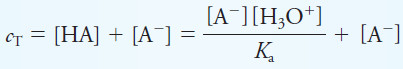
– Mass balance gives the total concentration of A-containing species, cT, as:
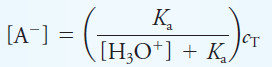
– Solving for [A–] yields
– If we substitute these latter two equations into the charge-balance equation, we get:
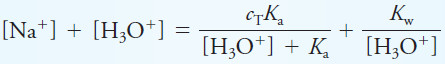
– By rearranging this equation, we obtain the master system equation for the entire titration:
![]()
– We must solve this cubic equation for each volume of NaOH added. Mathematical or spreadsheet software simplify this task.
– The concentrations of H3O+ found are then converted to pH values in the usual way to generate a titration curve of pH vs. volume of NaOH.
Reference
- Modern analytical chemistry / David Harvey / The McGraw-Hill Companies, Inc./ , 2000 . USA
- Dean’s Analytical Chemistry Handbook / Pradyot Patnaik / The McGraw-Hill Companies, 2nd Editionm, 2004 .USA
- Fundamentals of analytical chemistry / Douglas A. Skoog, Donald M. West, F. James Holler, Stanley R. Crouch. (ninth edition) , 2014 . USA