The Composition of Solutions During acid/Base Titration
– In this topic, we will discuss The Composition of Solutions During acid/Base Titration.
The Composition of Solutions During acid/Base Titration
– We are often interested in the changes in composition that occur while a solution of a weak acid or a weak base is being titrated.
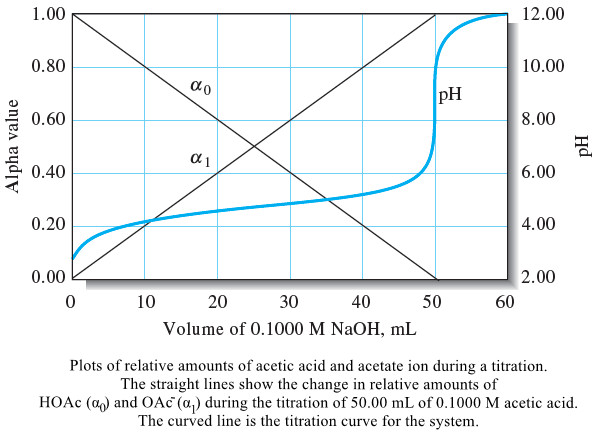
– These changes can be visualized by plotting the relative equilibrium concentration α0 of the weak acid as well as the relative equilibrium concentration of the conjugate base α1 as functions of the pH of the solution.
– The solid straight lines labeled α0 and α1 in the .
– The actual titration curve is shown as the curved line in following Figure.
– Note that at the beginning of the titration a0 is nearly 1 (0.987) meaning that 98.7% of the acetate containing species is present as HOAc and only 1.3% is present as OAc–.
– At the equivalence point, α0 decreases to 1.1 × 10⁻⁴, and α1 approaches 1.
– Thus, only about 0.011% of the acetate containing species is HOAc.
– Notice that, at the half-titration point (25.00 mL), α0 and α1 are both 0.5.
– For polyprotic acids , the alpha values are very useful in illustrating the changes in solution composition during titrations.
Locating Titration End Points from pH Measurements
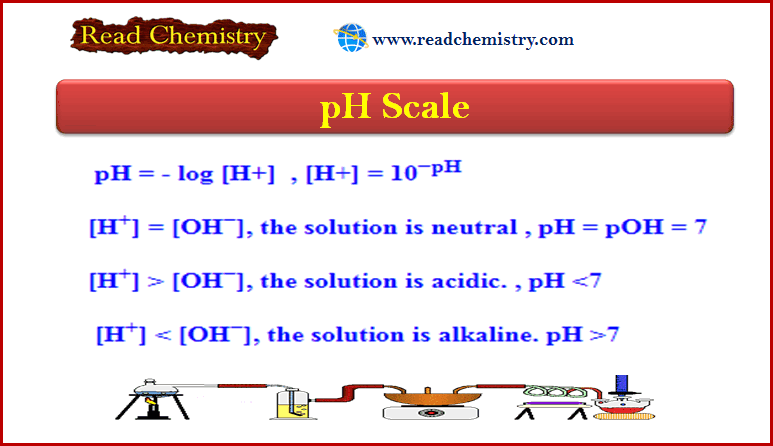
– Although indicators are still widely used in acid/base titration, the glass pH electrode and pH meter allow the direct measurement of pH as a function of titrant volume.
– The titration curve for the titration of 50.00 mL of 0.1000 M weak acid (Ka = 1.0 × 10⁻⁵) with 0.1000 M NaOH is shown in Figure (a).
– The end point can be located in several ways from the pH versus volume data.
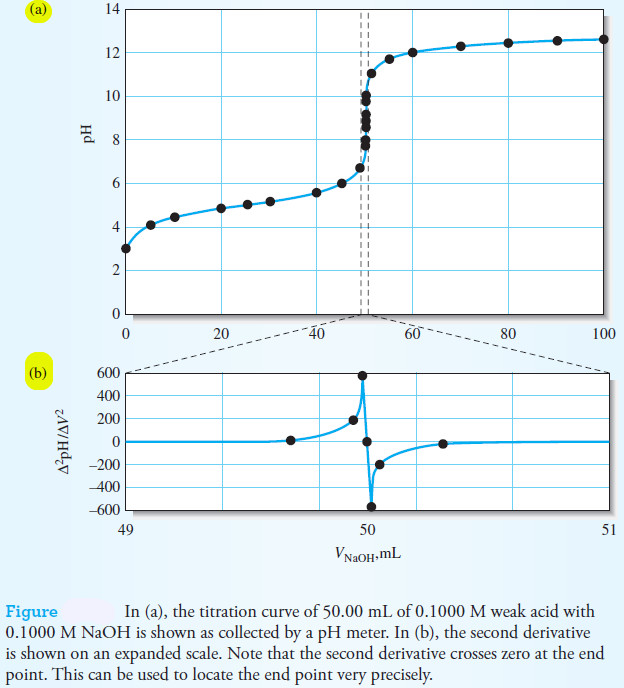
– The end point can be taken as the inflection point of the titration curve.
– With a sigmoid-shaped titration curve, the inflection point is the steepest part of the titration curve where the pH change with respect to volume is a maximum.
– This point can be estimated visually from the plot or we can use calculus to find the first and second derivatives of the titration curve.
– The first derivative, which is approximately ΔpH/ΔV, is the slope of the titration curve.
– It goes from nearly zero far before the end point to a maximum at the end point back to zero far beyond the end point.
– We can differentiate the curve a second time to locate the maximum of the first derivative since the slope of the first derivative changes dramatically from a large positive value to a large negative value as we pass through the maximum in the first derivative curve.
– This is the basis for locating the end point by taking the second derivative.
– The estimated second derivative, Δ2pH/ΔV2, is zero at the end point as shown in figure (b).
Note that we have expanded the scale to make it easier to locate the zero crossing of the second derivative.
– The Gran plot is an alternative method for locating the end point in a titration.
– In this method, a linear plot is produced that can reveal both the acid dissociation constant and the volume of base required to reach the end point.
Unlike the normal titration curve and derivative curves, which find the end point only from data located in the end point region, the Gran plot uses data far away from the end point.
– This method can decrease the tedium of making many measurements after dispensing tiny volumes of titrant in the end point region.
– Prior to the equivalence point of the titration of a weak acid with a strong base, the concentration of acid remaining, cHA, is given by
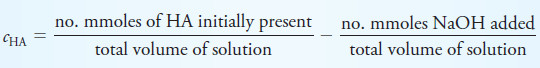
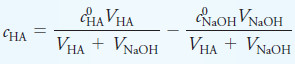
where c0HA is the initial analytical concentration of HA and c0NaOH the initial concentration of base.
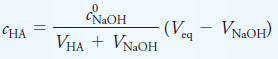
– The equivalence point volume of NaOH, Veq, can be found from the stoichiometry, which for a 1:1 reaction is given by
![]()
– Substituting for c0HAVHA in the equation for cHA and rearranging yield
– If Ka is not too large, the equilibrium concentration of acid in the preequivalence point region is approximately equal to the analytical concentration. That is
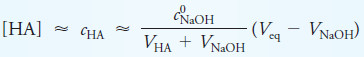
– With moderate dissociation of the acid, the equilibrium concentration of A– at any point is approximately the number of millimoles of base added divided by the total solution volume.

– The concentration of H3O+ can be found from the equilibrium constant as

– Multiplying both sides by VNaOH gives,
![]()
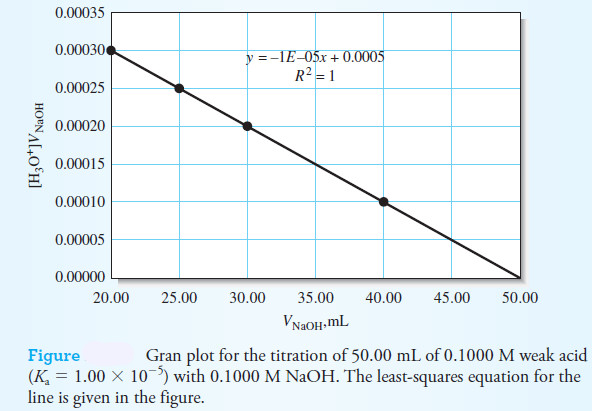
– A plot of the left-hand side of this equation versus the volume of titrant, VNaOH, should yield a straight line with a slope of -Ka and an intercept of KaVeq.
– In the following Figure , a Gran plot of the titration of 50.00 mL of 0.1000 M weak acid (Ka = 1.0 × 10⁻⁵) with 0.1000 M NaOH is shown along with the least-squares equation.
– From the intercept value of 0.0005, we calculate an end point volume of 50.00 mL by dividing by the value for Ka.
– Usually, points in the middle stages of the titration are plotted and used to obtain the slope and intercept values.
– The Gran plot can exhibit curvature in the early stages if Ka is too large, and it can curve near the equivalence point.
– When we rearrange this equation slightly, we have the slope-intercept form of a straight line:

In which
y = [H3O+]VNaOH,
m = slope = -Ka,
x = VNaOH
b = intercept = KaVeq
Reference
- Modern analytical chemistry / David Harvey / The McGraw-Hill Companies, Inc./ , 2000 . USA
- Dean’s Analytical Chemistry Handbook / Pradyot Patnaik / The McGraw-Hill Companies, 2nd Editionm, 2004 .USA
- Fundamentals of analytical chemistry / Douglas A. Skoog, Donald M. West, F. James Holler, Stanley R. Crouch. (ninth edition) , 2014 . USA