Titration Curves in Analytical Chemistry : Definition, Types
– In this topic, we will discuss the Titration Curves in Analytical Chemistry : Definition and Types
Titration Curves
– An end point is signaled by an observable physical change near the equivalence point of a titration.
– The two most widely used signals involve (1) changes in color due to the reagent (titrant), the analyte, or an indicator and (2) a change in potential of an electrode that responds to the titrant concentration or the analyte concentration.
– To understand the theoretical basis of end point determinations and the sources of titration errors, we calculate the data points necessary to construct titration curves for the systems under consideration.
– A titration curve is aplot of some function of the analyte or titrant concentration on the y axis versus titrant volume on the x axis.
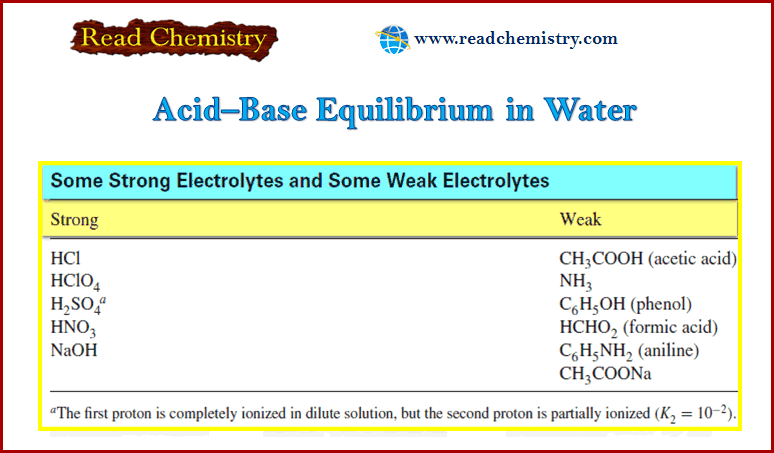
Types of Titration Curves
– Two general types of titration curves (and thus two general types of end points) occur in titrimetric methods.
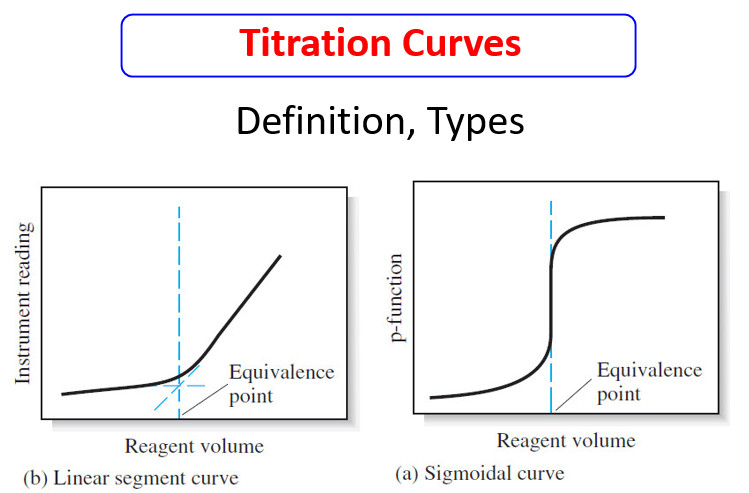
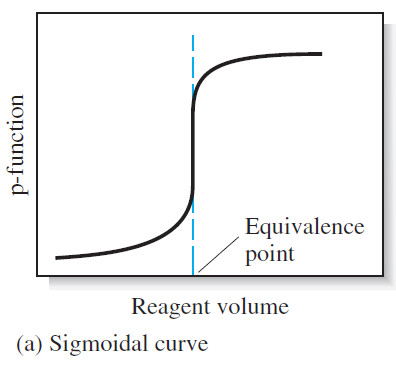
(1) A sigmoidal curve
– In the first type, called a sigmoidal curve, important observations are confined to a small region (typically 60.1 to 60.5 mL) surrounding the equivalence point.
– A sigmoidal curve in which the p-function of analyte (or sometimes the titrant) is plotted as a function of titrant volume is shown in Figure (a).
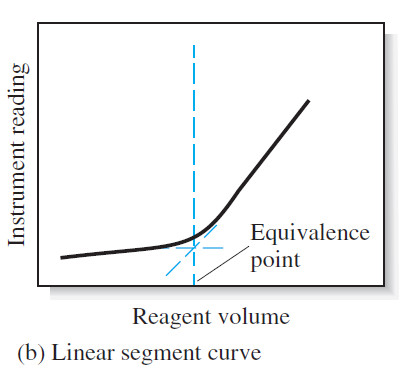
(2) linear segment curve
– In the second type of curve, called a linear segment curve, measurements are made on both sides of, but well away from, the equivalence point. Measurements near equivalence are avoided.
– In this type of curve, the vertical axis represents an instrument reading that is directly proportional to the concentration of the analyte or the titrant.
– A typical linear segment curve is found in Figure (b).
– The sigmoidal type offers the advantages of speed and convenience.
– The linear segment type is advantageous for reactions that are complete only in the presence of a considerable excess of the reagent or analyte.
Concentration Changes During Titrations
– The equivalence point in a titration is characterized by major changes in the relative concentrations of reagent and analyte.
– Table (1) illustrates this phenomenon.
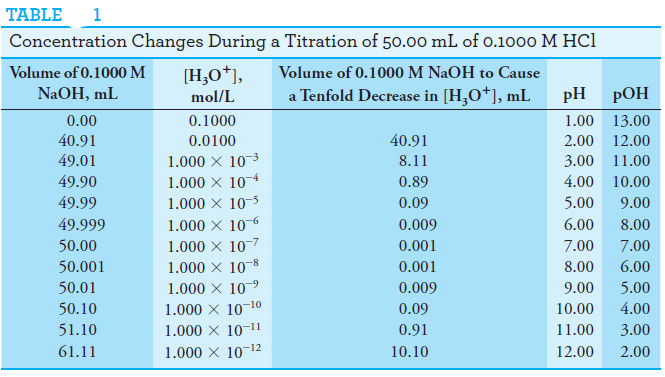
– The data in the second column of the table show the changes in the hydronium ion concentration as a 50.00-mL aliquot of a 0.1000 M solution of hydrochloric acid is titrated with 0.1000 M sodium hydroxide.
– The neutralization reaction is described by the equation:
H3O+ + OH– → 2H2O
– To emphasize the changes in relative concentration that occur in the equivalence point region, the volume increments computed are those required to cause tenfold decreases in the concentration of H3O+ (or tenfold increases in hydroxide ion concentration).
– Thus, we see in the third column that an addition of 40.91 mL of base is needed to decrease the concentration of H3O+ by one order of magnitude from 0.100 M to 0.0100 M.
– An addition of only 8.11 mL is required to lower the concentration by another factor of 10 to 0.00100 M; 0.89 mL causes yet another tenfold decrease.
– Corresponding increases in OH– concentration occur at the same time.
– End-point detection then depends on this large change in the relative concentration of the analyte (or titrant) that occurs at the equivalence point for every type of titration.
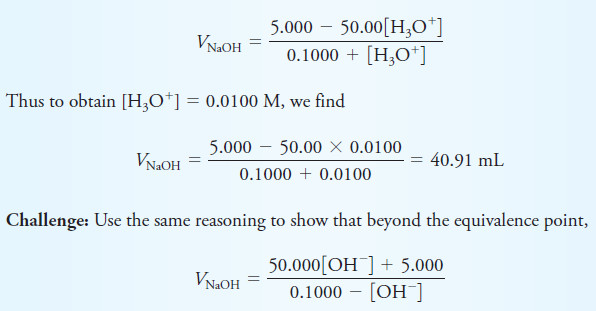
– Solved problem (1) describes how the volumes in the first column of Table (1) are calculated.
– The large changes in relative concentration that occur in the region of chemical equivalence are shown by plotting the negative logarithm of the analyte or the titrant concentration (the p function) against reagent volume, as seen in the following Figure:
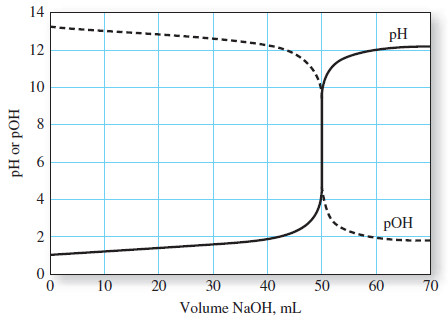
– The data for these plots are found in the fourth and fifth columns of Table(1).
– Titration curves for reactions involving complex formation, precipitation, and oxidation/reduction all exhibit the same sharp increase or decrease in p-function in the equivalence-point region as those shown in Figure above.
– Titration curves define the properties required of an indicator or instrument and allow us to estimate the error associated with titration methods.
Solved Problem (1)
Calculating the NaOH Volumes Shown in the First Column of Table (1)
– Prior to the equivalence point, [H3O+] equals the concentration of unreacted HCl (cHCl).
– The concentration of HCl is equal to the original number of millimoles of HCl (50.00 mL × 0.1000 M) minus the number of millimoles of NaOH added (VNaOH × 0.1000 M) divided by the total volume of the solution.

Conclusion of Titration Curves
– Titration curves are plots of a concentration-related variable versus titrant volume.
– The vertical axis in a sigmoidal titration curve is either the p-function of the analyte or titrant or the potential of an analyte- or titrant-sensitive electrode.
– The vertical axis of a linearsegment titration curve is an instrument signal that is proportional to the concentration of the analyte or titrant.
Reference
- Modern analytical chemistry / David Harvey / The McGraw-Hill Companies, Inc./ , 2000 . USA
- Dean’s Analytical Chemistry Handbook / Pradyot Patnaik / The McGraw-Hill Companies, 2nd Editionm, 2004 .USA
- Fundamentals of analytical chemistry / Douglas A. Skoog, Donald M. West, F. James Holler, Stanley R. Crouch. (ninth edition) , 2014 . USA